rmoff

June 28, 2011

Oracle 11g – How to force a sql_id to use a plan_hash_value using SQL Baselines

Filed under: etl, oracle, performance, plan management, sql plan baseline — rmoff @ 14:13

Here’s a scenario that’ll be depressingly familiar to most reading this: after ages of running fine, and no changes to the code, a query suddenly starts running for magnitudes longer than it used to.

In this instance it was an ETL step which used to take c.1 hour, and was now at 5 hours and counting. Since it still hadn’t finished, and the gods had conspired to bring down Grid too (unrelated), I generated a SQL Monitor report to see what was happening:

select DBMS_SQLTUNE.REPORT_SQL_MONITOR(
   type=>'HTML',
   report_level=>'ALL',sql_id=>'939abmqmvcc4d') as report
FROM dual;

(h/t to Martin Berger for this)

It showed a horrendous explain plan:

A very naughty plan

Using Kerry Osborne’s script to look at the plan_hash_value over time from AWR, it was clear that the CBO had picked a new, bad, explain plan.

So we knew the sql_id, and we knew the plan_hash_value of the plan which we wanted the CBO to use. But how to do this?

Back to Kerry Osborne again, and his article about SQL Plan Baselines. He (and others) write in detail about how and what SQL Plan Baselines are, but in essence it lets you tell Oracle which plan to use (or optionally, prefer) for a given sql_id.

Since the desired plan_hash_value was no longer in the cursor cache, we could get it back from AWR, loaded in via a SQL Tuning Set. Here’s the code with in-line comments explaining the function of each block:

/* 
Set up a SQL Baseline using known-good plan, sourced from AWR snapshots
https://rnm1978.wordpress.com/

In this example, sql_id is 939abmqmvcc4d and the plan_hash_value of the good plan that we want to force is 1239572551
*/

-- Drop SQL Tuning Set (STS)
BEGIN
  DBMS_SQLTUNE.DROP_SQLSET(
    sqlset_name => 'MySTS01');
END;

-- Create SQL Tuning Set (STS)
BEGIN
  DBMS_SQLTUNE.CREATE_SQLSET(
    sqlset_name => 'MySTS01',
    description => 'SQL Tuning Set for loading plan into SQL Plan Baseline');
END;

-- Populate STS from AWR, using a time duration when the desired plan was used
--  List out snapshot times using :   SELECT SNAP_ID, BEGIN_INTERVAL_TIME, END_INTERVAL_TIME FROM dba_hist_snapshot ORDER BY END_INTERVAL_TIME DESC;
--  Specify the sql_id in the basic_filter (other predicates are available, see documentation)
DECLARE
  cur sys_refcursor;
BEGIN
  OPEN cur FOR
    SELECT VALUE(P)
    FROM TABLE(
       dbms_sqltune.select_workload_repository(begin_snap=>22673, end_snap=>22710,basic_filter=>'sql_id = ''939abmqmvcc4d''',attribute_list=>'ALL')
              ) p;
     DBMS_SQLTUNE.LOAD_SQLSET( sqlset_name=> 'MySTS01', populate_cursor=>cur);
  CLOSE cur;
END;
/

-- List out SQL Tuning Set contents to check we got what we wanted
SELECT 
  first_load_time          ,
  executions as execs              ,
  parsing_schema_name      ,
  elapsed_time  / 1000000 as elapsed_time_secs  ,
  cpu_time / 1000000 as cpu_time_secs           ,
  buffer_gets              ,
  disk_reads               ,
  direct_writes            ,
  rows_processed           ,
  fetches                  ,
  optimizer_cost           ,
  sql_plan                ,
  plan_hash_value          ,
  sql_id                   ,
  sql_text
   FROM TABLE(DBMS_SQLTUNE.SELECT_SQLSET(sqlset_name => 'MySTS01')
             );

-- List out the Baselines to see what's there
SELECT * FROM dba_sql_plan_baselines ;

-- Load desired plan from STS as SQL Plan Baseline
-- Filter explicitly for the plan_hash_value here if you want
DECLARE
my_plans pls_integer;
BEGIN
  my_plans := DBMS_SPM.LOAD_PLANS_FROM_SQLSET(
    sqlset_name => 'MySTS01', 
    basic_filter=>'plan_hash_value = ''1239572551'''
    );
END;
/

-- List out the Baselines
SELECT * FROM dba_sql_plan_baselines ;

Now when the query’s run, it will use the desired plan.

Things to note:

  • In 10g and 11gR1 the default for SELECT_WORKLOAD_REPOSITORY is to return only BASIC information, which excludes the plan! So DBMS_SPM.LOAD_PLANS_FROM_SQLSET doesn’t load any plans.
    • It doesn’t throw a warning either, which it could sensibly, since the STS has no plan, and it can see that</grumble>
    • This changes to TYPICAL in 11gR2 (thanks Surachart!)
  • Parameter “optimizer_use_sql_plan_baselines” must be set to TRUE for a baseline to be used
  • Flush the cursor cache after loading the baseline to make sure it gets picked up on next execution of the sql_id

References:

Thanks to John Hallas for his help with this problem.

December 31, 2010

Data Warehousing and Statistics in Oracle 11g – incremental global statistics

Filed under: etl, oracle, Statistics — rmoff @ 00:39

This is a series of posts where I hope to humbly plug some gaps in the information available (or which has escaped my google-fu) regarding statistics management in Oracle 11g specific to Data Warehousing.

Incremental Global Statistics is new functionality in Oracle 11g (and 10.2.0.4?) and is explained in depth in several places including:

In essence, Oracle maintains information about each partition when statistics is gathered on the partition, and it uses this to work out the global statistics – without having to scan the whole table. For a more detailed description, see the above links. It’s important to note that this is not the same as aggregated global statistics (which Doug Burns covers in detail here)

To use it, you there are two conditions:

  1. The INCREMENTAL value for a partition table is set to TRUE
  2. You gather statistics on that table with the GRANULARITY parameter set to AUTO

Too good to be true?

From what I’d read, it sounded ideal for what we do, which is load big (10M+ rows per day) tables, partitioned on day. However, when I started testing it I discovered what may be a problem. The information about each partition is stored in the SYSAUX tablespace in two tables:

  • SYS.WRI$_OPTSTAT_SYNOPSIS_HEAD$
  • SYS.WRI$_OPTSTAT_SYNOPSIS$

Looking at the WRI$_OPTSTAT_SYNOPSIS$ table on one of our databases, it had 216 million rows in and took up about 16GB of space. The documentation does say “the SYSAUX tablespace consumes additional space to maintain the global statistics” but this is an awful lot of space.

When I ran a test to gather incremental statistics on a two-partition table with a single row in each partition, it took three minutes to gather stats each time! A quick look at SQL Monitor showed that a lot of the time was spent on a DELETE from WRI$_OPTSTAT_SYNOPSIS$.

In a database with no other data in WRI$_OPTSTAT_SYNOPSIS$, the stats gather was sub-second.

Looking at the data on WRI$_OPTSTAT_SYNOPSIS$, it can be determined that for every table, partition, and column, there is an entry on the header table WRI$_OPTSTAT_SYNOPSIS_HEAD$. There is a unique synopsis number given to each combination, which has one or many entries on the synopsis hash table WRI$_OPTSTAT_SYNOPSIS$. There seems to be one hash for every distinct value in the table/partition/column.

Behind the scenes

You can check whether a table is set for INCREMENTAL global statistics in two ways.
For an individual table, dbms_stats.get_prefs will return the value:

select dbms_stats.get_prefs(ownname=>'HR',pname=>'INCREMENTAL', tabname=>'BASE_T1') from dual;

Alternatively, to list all tables in the database that have INCREMENTAL set, use this:

select u.name "OWNER" ,o.name "TABLE_NAME" ,p.valchar
from  sys.OPTSTAT_USER_PREFS$ p 
inner join sys.obj$ o on p.obj#=o.obj# 
inner join sys.user$ u on o.owner#=u.user#
where p.PNAME = 'INCREMENTAL'

To look at the synopses (synopsii?), use this query:

SELECT u.NAME                                          "owner",
       o.NAME                                          "table_name",
       p.subname                                       "partition_name",
       c.NAME                                          "column_name",
       to_char(h.analyzetime, 'YYYY-MM-DD-HH24:MI:SS') "analyse_Time",
       COUNT(*)                                        "hash entries"
FROM   sys.wri$_optstat_synopsis_head$ h
       left join sys.wri$_optstat_synopsis$ s
         ON h.synopsis# = s.synopsis#
       left join sys.obj$ o
         ON h.bo# = o.obj#
       left join sys.user$ u
         ON o.owner# = u.user#
       left join sys.col$ c
         ON h.bo# = c.obj#
            AND h.intcol# = c.intcol#
       left join (SELECT bo#,
                         obj#
                  FROM   sys.tabpart$
                  UNION ALL
                  SELECT bo#,
                         obj#
                  FROM   sys.tabcompart$) tp
         ON h.bo# = tp.bo#
            AND h.group# = tp.obj# * 2
       left join sys.obj$ p
         ON tp.obj# = p.obj#
GROUP  BY u.NAME,
          o.NAME,
          p.subname,
          c.NAME,
          h.analyzetime
ORDER  BY u.NAME,
          o.NAME,
          c.NAME;  

Test case

This is the test case I’ve been using to investigate the issue. It is hopefully self-documenting.

I’ve written a set of queries that examine the statistics in the data dictionary so that I can see how they get built up.
USER_TAB_STATS_HISTORY is good for seeing a chronological record of the stats gathers.

/* https://rnm1978.wordpress.com/ */

--
-- *****************************
--  test_incr_stats.sql
--
--  Test incremental statistic gathering
-- *****************************
--

set echo off
set timing off
set feedback on


prompt
prompt ************
prompt Check the current size of the synopsis table WRI$_OPTSTAT_SYNOPSIS$

select table_name, num_rows from dba_tables where table_name like 'WRI$_OPTSTAT_SYNOPSIS%';

select to_char(min(h.analyzetime),'YYYY-MM-DD-HH24:MI:SS') "Earliest Synopsis"
FROM    SYS.WRI$_OPTSTAT_SYNOPSIS_HEAD$ h;


prompt
prompt ************
prompt Create a simple test table

drop table BASE_T1;
CREATE TABLE BASE_T1 ( day_key   INTEGER, store_num INTEGER, fact_01   NUMBER(38,4) DEFAULT 0)
PARTITION BY RANGE ( "DAY_KEY") ( PARTITION PART_1 VALUES LESS THAN (2) NOCOMPRESS,
                            PARTITION PART_2 VALUES LESS THAN (3) NOCOMPRESS)
PARALLEL;

prompt
prompt ************
prompt Set the table to INCREMENTAL stats
exec dbms_stats.set_table_prefs(pname=>'INCREMENTAL',ownname=>USER,tabname=>'BASE_T1',pvalue=>'TRUE');


prompt
prompt ************
prompt Gather initial stats
set timing on
exec dbms_stats.gather_table_stats(     ownname=>USER, tabname=>'BASE_T1', granularity=>'AUTO');
set timing off


prompt
prompt ************
prompt Add one row of data to partition 1
insert into base_t1 (day_key,store_num,fact_01) values (1, 1,10);


prompt
prompt ************
prompt Gather stats
set timing on
exec dbms_stats.gather_table_stats(     ownname=>USER, tabname=>'BASE_T1', granularity=>'AUTO');
set timing off


prompt
prompt ************
prompt Add one row of data to partition 2
insert into base_t1 (day_key,store_num,fact_01) values (2, 1,10);


prompt
prompt ************
prompt Gather stats
set timing on
exec dbms_stats.gather_table_stats(     ownname=>USER, tabname=>'BASE_T1', granularity=>'AUTO');
set timing off


prompt
prompt ************
prompt Add another row of data to partition 1, with a new store_num value
insert into base_t1 (day_key,store_num,fact_01) values (1, 2,10);


prompt
prompt ************
prompt Gather stats
set timing on
exec dbms_stats.gather_table_stats(     ownname=>USER, tabname=>'BASE_T1', granularity=>'AUTO');
set timing off


set linesize 156
col table_name for a12
col partition_name for a14
col column_name for a12
col high_value for a8
col low_value for a8
col global_stats head "Global|Stats" for a7
col stale_stats head "Stale|Stats" for a5

prompt
prompt Incremental stats setting:
select dbms_stats.get_prefs(ownname=>USER,pname=>'INCREMENTAL', tabname=>'BASE_T1') from dual;

prompt
prompt Actual data in the table:
select day_key,count(*) from BASE_T1 group by day_key order by day_key asc;

prompt
prompt USER_TAB_STATISTICS:
select table_name,partition_name,num_rows,sample_size,
to_char(last_analyzed,'YYYY-MM-DD-HH24:MI:SS') "Last Analyzed",global_stats,stale_stats
from user_tab_statistics where table_name='BASE_T1';

prompt
prompt USER_TAB_STATS_HISTORY:
select table_name,partition_name,stats_update_time from user_tab_stats_history where table_name='BASE_T1'
order by stats_update_time asc
;

prompt
prompt USER_TAB_COL_STATISTICS:
select table_name,column_name,sample_size,to_char(last_analyzed,'YYYY-MM-DD-HH24:MI:SS') "Last Analyzed",
global_stats,num_distinct,low_value,high_value
from USER_TAB_COL_STATISTICS where table_name='BASE_T1';

prompt
prompt USER_PART_COL_STATISTICS:
select table_name,partition_name,column_name,sample_size,to_char(last_analyzed,'YYYY-MM-DD-HH24:MI:SS') "Last Analyzed",
global_stats,num_distinct,low_value,high_value
from USER_PART_COL_STATISTICS where table_name='BASE_T1';

prompt
prompt Synopsis data:
SELECT o.name "TABLE_NAME"
        ,p.subname "Part"
        ,c.name "Column"
        ,to_char(h.analyzetime,'YYYY-MM-DD-HH24:MI:SS') "Analyse Time"
        ,count(*) "Hash count"
FROM    SYS.WRI$_OPTSTAT_SYNOPSIS_HEAD$ h
left join sys.wri$_optstat_synopsis$ s on h.synopsis# = s.synopsis#
left join sys.obj$ o on h.bo#=o.obj#
left join sys.user$ u on o.owner#=u.user#
left join sys.col$ c on h.bo#=c.obj# and h.intcol# = c.intcol#
left join (select bo#,obj# from sys.tabpart$ union all select bo#,obj# from sys.tabcompart$) tp on h.bo#=tp.bo# and h.group#=tp.obj#*2
left join sys.obj$ p on tp.obj#=p.obj#
where  u.name = USER and o.name = 'BASE_T1'
group by u.name,o.name ,p.subname,c.name,h.analyzetime
order by u.name,o.name;

Results

This was run on Oracle 11.1.0.7, on several different databases. I’ve edited the output slightly for brevity.

Where SYS.WRI$_OPTSTAT_SYNOPSIS is small, it can be seen that the stats gather is fast – as would be expected for a table so small:

************
Check the current size of the synopsis table WRI$_OPTSTAT_SYNOPSIS$

TABLE_NAME     NUM_ROWS
------------ ----------
WRI$_OPTSTAT          0
WRI$_OPTSTAT       1940
WRI$_OPTSTAT     287236

Gather initial stats
PL/SQL procedure successfully completed.
Elapsed: 00:00:00.16
************
Add one row of data to partition 1
************
Gather stats
PL/SQL procedure successfully completed.
Elapsed: 00:00:00.27
************
Add one row of data to partition 2
************
Gather stats
PL/SQL procedure successfully completed.
Elapsed: 00:00:00.27
************
Add another row of data to partition 1, with a new store_num value
************
Gather stats
PL/SQL procedure successfully completed.
Elapsed: 00:00:00.34

Incremental stats setting:
DBMS_STATS.GET_PREFS(OWNNAME=>USER,PNAME=>'INCREMENTAL',TABNAME=>'BASE_T1')
------------------------------------------------------------------------------------------------
TRUE

Actual data in the table:

   DAY_KEY   COUNT(*)
---------- ----------
         1          2
         2          1

2 rows selected.


USER_TAB_STATISTICS:

                                                                       Global  Stale
TABLE_NAME   PARTITION_NAME   NUM_ROWS SAMPLE_SIZE Last Analyzed       Stats   Stats
------------ -------------- ---------- ----------- ------------------- ------- -----
BASE_T1                              3           3 2010-12-30-18:04:56 YES     NO
BASE_T1      PART_1                  2           2 2010-12-30-18:04:56 YES     NO
BASE_T1      PART_2                  1           1 2010-12-30-18:04:56 YES     NO

3 rows selected.


USER_TAB_STATS_HISTORY:

TABLE_NAME   PARTITION_NAME STATS_UPDATE_TIME
------------ -------------- ---------------------------------------------------------------------------
BASE_T1      PART_1         30-DEC-10 18.04.55.633710 +00:00
BASE_T1      PART_2         30-DEC-10 18.04.55.633710 +00:00
BASE_T1                     30-DEC-10 18.04.55.645162 +00:00
BASE_T1      PART_1         30-DEC-10 18.04.55.856920 +00:00
BASE_T1                     30-DEC-10 18.04.55.910722 +00:00
BASE_T1      PART_2         30-DEC-10 18.04.56.126645 +00:00
BASE_T1                     30-DEC-10 18.04.56.181336 +00:00
BASE_T1      PART_1         30-DEC-10 18.04.56.442624 +00:00
BASE_T1                     30-DEC-10 18.04.56.527702 +00:00

9 rows selected.


USER_TAB_COL_STATISTICS:

                                                          Global
TABLE_NAME   COLUMN_NAME  SAMPLE_SIZE Last Analyzed       Stats   NUM_DISTINCT LOW_VALU HIGH_VAL
------------ ------------ ----------- ------------------- ------- ------------ -------- --------
BASE_T1      DAY_KEY                3 2010-12-30-18:04:56 YES                2 C102     C103
BASE_T1      STORE_NUM              3 2010-12-30-18:04:56 YES                2 C102     C103
BASE_T1      FACT_01                3 2010-12-30-18:04:56 YES                1 C10B     C10B

3 rows selected.


USER_PART_COL_STATISTICS:

                                                                         Global
TABLE_NAME   PARTITION_NAME COLUMN_NAME  SAMPLE_SIZE Last Analyzed       Stats   NUM_DISTINCT LOW_VALU HIGH_VAL
------------ -------------- ------------ ----------- ------------------- ------- ------------ -------- --------
BASE_T1      PART_1         DAY_KEY                2 2010-12-30-18:04:56 YES                1 C102     C102
BASE_T1      PART_1         STORE_NUM              2 2010-12-30-18:04:56 YES                2 C102     C103
BASE_T1      PART_1         FACT_01                2 2010-12-30-18:04:56 YES                1 C10B     C10B
BASE_T1      PART_2         DAY_KEY                1 2010-12-30-18:04:56 YES                1 C103     C103
BASE_T1      PART_2         STORE_NUM              1 2010-12-30-18:04:56 YES                1 C102     C102
BASE_T1      PART_2         FACT_01                1 2010-12-30-18:04:56 YES                1 C10B     C10B

6 rows selected.


Synopsis data:

TABLE_NAME   Part                           Column                         Analyse Time        Hash count
------------ ------------------------------ ------------------------------ ------------------- ----------
BASE_T1      PART_2                         DAY_KEY                        2010-12-30-18:04:56          1
BASE_T1      PART_2                         FACT_01                        2010-12-30-18:04:56          1
BASE_T1      PART_1                         STORE_NUM                      2010-12-30-18:04:56          2
BASE_T1      PART_1                         DAY_KEY                        2010-12-30-18:04:56          1
BASE_T1      PART_2                         STORE_NUM                      2010-12-30-18:04:56          1
BASE_T1      PART_1                         FACT_01                        2010-12-30-18:04:56          1

6 rows selected.

Note that there are two hash values for the synopsis for PART_1 column STORE_NUM, because there are two values in the column in that partition.

You can see clearly from USER_TAB_STATS_HISTORY three things:

  1. The order in which stats are gathered – partitions, and then table
  2. That partitions that have not been updated are not re-analyzed
  3. That global stats are updated each time the stats gather is run

Where SYS.WRI$_OPTSTAT_SYNOPSIS is large, stats gather is much slower:

Check the current size of the synopsis table WRI$_OPTSTAT_SYNOPSIS$

TABLE_NAME                       NUM_ROWS
------------------------------ ----------
WRI$_OPTSTAT_SYNOPSIS_PARTGRP           0
WRI$_OPTSTAT_SYNOPSIS_HEAD$         64259
WRI$_OPTSTAT_SYNOPSIS$          216854569

************
Gather initial stats
Elapsed: 00:00:00.57
************
Add one row of data to partition 1
************
Gather stats
Elapsed: 00:03:04.58
************
Add one row of data to partition 2
************
Gather stats
Elapsed: 00:02:25.20
************
Add another row of data to partition 1, with a new store_num value
************
Gather stats
Elapsed: 00:02:25.76
************

Actual data in the table:

   DAY_KEY   COUNT(*)
---------- ----------
         1          2
         2          1

USER_TAB_STATISTICS:

                                                                       Global  Stale
TABLE_NAME   PARTITION_NAME   NUM_ROWS SAMPLE_SIZE Last Analyzed       Stats   Stats
------------ -------------- ---------- ----------- ------------------- ------- -----
BASE_T1                              3           3 2010-12-30-17:51:34 YES     NO
BASE_T1      PART_1                  2           2 2010-12-30-17:50:53 YES     NO
BASE_T1      PART_2                  1           1 2010-12-30-17:48:27 YES     NO

USER_TAB_STATS_HISTORY:

TABLE_NAME   PARTITION_NAME STATS_UPDATE_TIME
------------ -------------- ---------------------------------------------------------------------------
BASE_T1      PART_1         30-DEC-10 17.43.39.320426 +00:00
BASE_T1      PART_2         30-DEC-10 17.43.39.320426 +00:00
BASE_T1                     30-DEC-10 17.43.39.360753 +00:00
BASE_T1      PART_1         30-DEC-10 17.46.02.331166 +00:00
BASE_T1                     30-DEC-10 17.46.43.939090 +00:00
BASE_T1      PART_2         30-DEC-10 17.48.27.926559 +00:00
BASE_T1                     30-DEC-10 17.49.09.144722 +00:00
BASE_T1      PART_1         30-DEC-10 17.50.53.818049 +00:00
BASE_T1                     30-DEC-10 17.51.34.915096 +00:00

USER_TAB_COL_STATISTICS:

                                                          Global
TABLE_NAME   COLUMN_NAME  SAMPLE_SIZE Last Analyzed       Stats   NUM_DISTINCT LOW_VALU HIGH_VAL
------------ ------------ ----------- ------------------- ------- ------------ -------- --------
BASE_T1      DAY_KEY                3 2010-12-30-17:51:34 YES                2 C102     C103
BASE_T1      STORE_NUM              3 2010-12-30-17:51:34 YES                2 C102     C103
BASE_T1      FACT_01                3 2010-12-30-17:51:34 YES                1 C10B     C10B

USER_PART_COL_STATISTICS:

                                                                         Global
TABLE_NAME   PARTITION_NAME COLUMN_NAME  SAMPLE_SIZE Last Analyzed       Stats   NUM_DISTINCT LOW_VALU HIGH_VAL
------------ -------------- ------------ ----------- ------------------- ------- ------------ -------- --------
BASE_T1      PART_1         DAY_KEY                2 2010-12-30-17:50:53 YES                1 C102     C102
BASE_T1      PART_1         STORE_NUM              2 2010-12-30-17:50:53 YES                2 C102     C103
BASE_T1      PART_1         FACT_01                2 2010-12-30-17:50:53 YES                1 C10B     C10B
BASE_T1      PART_2         DAY_KEY                1 2010-12-30-17:48:27 YES                1 C103     C103
BASE_T1      PART_2         STORE_NUM              1 2010-12-30-17:48:27 YES                1 C102     C102
BASE_T1      PART_2         FACT_01                1 2010-12-30-17:48:27 YES                1 C10B     C10B

Synopsis data:

TABLE_NAME   Part                           Column                         Analyse Time        Hash count
------------ ------------------------------ ------------------------------ ------------------- ----------
BASE_T1      PART_1                         FACT_01                        2010-12-30-17:50:53          1
BASE_T1      PART_2                         DAY_KEY                        2010-12-30-17:48:27          1
BASE_T1      PART_1                         STORE_NUM                      2010-12-30-17:50:53          2
BASE_T1      PART_2                         FACT_01                        2010-12-30-17:48:27          1
BASE_T1      PART_2                         STORE_NUM                      2010-12-30-17:48:27          1
BASE_T1      PART_1                         DAY_KEY                        2010-12-30-17:50:53          1

Why the worry?

My worry is that with wide tables and many partitions, the synopsis history could grow very large. In the same way that FTS of a big table to gather global stats the ‘old’ way is going to get slower as the size increases, is the same going to happen with incremental stats?

I’ve dug around on My Oracle Support but not hit any specific bugs on this.

I found a posting on OTN describing the same behaviour as I’ve found, but with the comment “Oracle […] just tell me that it is normal, expected behaviour and that if I don’t like it I should turn off Incremental global stats.”.

Doing some back-of-a-fag-packet maths with some of our tables would have the synopsis information growing at 150k rows per day for one table. We’ve quite a few wide & big tables, and unless we can convince our users to make do with no history 😉 they’re going to keep growing.

Hopefully someone will see this and point out something I’ve not understood about the functionality, or missed in the documentation.
If not, then I’m going to do some larger-scale testing to try and put numbers around stats gather times using incremental vs non-incremental. If nothing else, to get a better understanding of how big this table could be growing.

I’d be really interested to know what other data warehousing sites on 11g do in terms of partitioned table statistics and whether they use incremental stats or not.

Comments most welcome, please! 🙂

November 3, 2010

Analysing ODI batch performance

Filed under: etl, odi, performance — rmoff @ 21:38

I’ve been involved with some performance work around an ODI DWH load batch. The batch comprises well over 1000 tasks in ODI, and whilst the Operator console is not a bad interface, it’s not very easy to spot the areas consuming the most runtime.

Here’s a set of SQL statements to run against the ODI work repository tables to help you methodically find the steps of most interest for tuning efforts.

odi_04.sql — Session runtimes, including child sessions

First off is the most fancy – using hierarchical SQL, it returns all sessions and child sessions:

-- odi_04.sql
-- 
-- ODI sessions and child sessions - runtimes
-- 
-- https://rnm1978.wordpress.com/
--

select --level,
	--, parent_sess_no 
    sess_no,  
  --Following column can be included if you want to see the root parent session name
	--CONNECT_BY_ROOT sess_name "Root session",
  --
  -- Remove the lpad if you don't want child sessions indented in the results
	lpad('> ',3*(level-1),'-') || sess_name "Name",
	TO_CHAR(SESS_BEG,'yyyy-mm-dd hh24:mi:ss') as "Session Start",
	TO_CHAR(SESS_END,'yyyy-mm-dd hh24:mi:ss') as "Session End",
	SESS_DUR,
	SESS_STATUS
from SNP_SESSION 
-- You can determine how many levels to navigate: level 1 is the master sessions and no children, level 2 is the first layer of children, etc.
--where level <= 3
start with 	    parent_sess_no is null 
-- Use a mixture of the following predicates to identify your batch within the ODI Work Repository, and/or part of the batch of interest
--              and sess_name like '%LOAD%'
--		          and sess_status = 'D' 
		          and sess_beg between to_date('1/11/2010 09:00','DD/MM/YYYY HH24:MI') and to_date('4/11/2010 18:00','DD/MM/YYYY HH24:MI')
connect by prior sess_no 	= parent_sess_no
/

This would return something similar to this:

Example output from odi_04

It’s worth noting a couple of things:

  • “D” status means “Done”. There’s a table in the ODI repository that decodes statuses, although they’re normally obvious
  • Seconds is the total for the session, including child sessions. So in the example shown, “LOAD_FACT1_TRANS_BATCH” takes a total of 4510 seconds, which is comprised of tasks within the session (see below), plus the runtime of LOAD_FACT1_STUFF (64 seconds) and LOAD_FACT1_SALES (4443 seconds).

From this example, there are plenty of long-running steps, so let’s pick one I prepared earlier, session number 984170, “LOAD_FACT1_SALES”, which is a child session of “LOAD_FACT1_TRANS_BATCH” (session number 980170).

odi_06.sql — Session runtime, broken down by step

Using the session number determined by our analysis of the overall batch session runtimes, here’s a query to show the runtime for each step in the session. It is possible to combine this with the hierarchical SQL of above, but I personally found it resulted in too much data to sift though as well as increasing the chances of random stabbing at big numbers. By picking a session from the first query for deliberate further analysis the mind is focussed on it.

-- odi_06.sql
-- 
-- ODI session broken down by step, for a single session
-- 
-- https://rnm1978.wordpress.com/
--
 
select  s.sess_no "Session #",
	sl.nno as "Step Number",
	sess_name "Session Name",
	ss.step_name "Step Name",
  to_char(sl.step_beg,'yyyy-mm-dd hh24:mi:ss') "Step Start",
  to_char(sl.step_end,'yyyy-mm-dd hh24:mi:ss') "Step End",
	sl.step_dur "Step Dur (s)",
from SNP_SESSION S
	left outer join snp_sess_step ss
	on s.sess_no = ss.sess_no
	inner join SNP_STEP_LOG SL
	on ss.sess_no = sl.sess_no
	and ss.nno = sl.nno
where   s.sess_no = 984170
;

For our example session it would give us output something like this:

Example output from odi_06.sql

So now we can see that of a long-running load step, over 80% of the time is spent on the step “Int. Table2 Merge”, step number 3

odi_07.sql — Session runtime, broken down task, for a given step

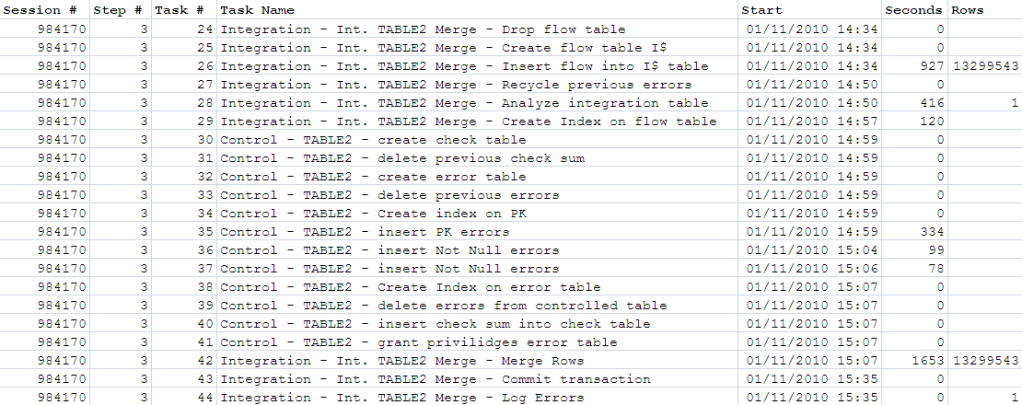
Using the same session number as before, and step number 3 as identified above, let’s have a look at the individual tasks:

-- odi_07.sql
-- 
-- ODI session broken down by task, for a given session and step
-- 
-- https://rnm1978.wordpress.com/
--
 
select  s.sess_no as "Session #",
  sl.nno as "Step #",
	st.scen_task_no as "Task #",
	st.task_name1 || ' - ' || st.task_name2 || ' - ' || st.task_name3 "Task",
  to_char(stl.task_beg,'yyyy-mm-dd hh24:mi:ss') "Task Start",
	stl.task_dur,
	stl.nb_row
from SNP_SESSION S
	left outer join snp_sess_step ss
	on s.sess_no = ss.sess_no
	inner join SNP_STEP_LOG SL
	on ss.sess_no = sl.sess_no
	and ss.nno = sl.nno
	inner join SNP_SESS_TASK ST
	on SS.sess_no = st.sess_no
	and ss.nno = st.nno
	inner join SNP_SESS_TASK_LOG STL
	ON SL.SESS_NO = STL.SESS_NO
	and SL.nno = STL.nno
	and SL.nb_run = STL.nb_run
	and st.scen_task_no = stl.scen_task_no
where   s.sess_no = 984170 
    and sl.nno = 3
;

Example output from odi_07.sql

So from here I’d be focussing on two things:

  • Of the long-running tasks, can they be tuned?
  • Is this whole step using the most efficient logic? Could some of the tasks be combined or removed entirely? Could the load be done in a better way?

More funky stuff

odi_08.sql – Identify task optimisation candidates

At first glance this is a quick-win for listing out the longest running tasks within a batch. And it is that. But, beware of taking a blinkered view of tasks in isolation. The advantage of using the queries above to drill down from overall batch runtime down through sessions, steps, and then to tasks, is that you have the context of the task. Still, this query that follows can be useful for a quick hit list of tasks to check that have been covered off by more detailed analysis.

-- odi_08.sql
-- 
-- ODI task optimisation candidates
-- 
-- https://rnm1978.wordpress.com/
--

select DISTINCT 
      --level
  st.task_name1 || ' - ' || st.task_name2 || ' - ' || st.task_name3 "Task",
 	stl.task_dur,
  stl.nb_row,
  s.sess_no || '/' ||  sl.nno || '/' || stl.scen_task_no as "Session/Step/Task #",  
  SYS_CONNECT_BY_PATH(s.sess_name, ' / ') || ' / ' ||	ss.step_name "Step Name"
from SNP_SESSION S
	left outer join snp_sess_step ss
	on s.sess_no = ss.sess_no
	inner join SNP_STEP_LOG SL
	on ss.sess_no = sl.sess_no
	and ss.nno = sl.nno
	inner join SNP_SESS_TASK ST
	on SS.sess_no = st.sess_no
	and ss.nno = st.nno
	inner join SNP_SESS_TASK_LOG STL
	ON SL.SESS_NO = STL.SESS_NO
	and SL.nno = STL.nno
	and SL.nb_run = STL.nb_run
	and st.scen_task_no = stl.scen_task_no
where stl.task_dur > &&min_duration_secs
and st.task_name3 != 'Run_Subscribed_Process_ID' -- Ignore parent tasks of child sessions
start with 	    parent_sess_no is null 
		and sess_beg between to_date('1/11/2010 09:00','DD/MM/YYYY HH24:MI') and to_date('1/11/2010 18:00','DD/MM/YYYY HH24:MI')
connect by prior s.sess_no 	= s.parent_sess_no
order by stl.task_dur desc
/

Example output from odi_08.sql

As can be seen clearly from this, there are several different types of task within ODI and not all with have a row count associated with them.

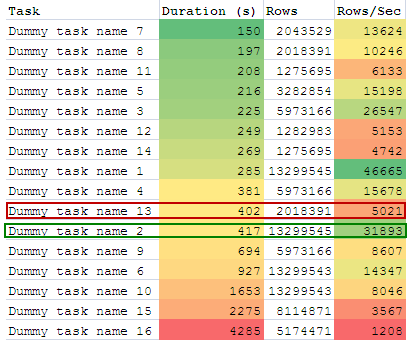
We can start doing more advanced analysis using this data. For example, of the tasks that do return row counts, what rows/sec throughput are we getting? Are there any steps where the throughput is abnormally low, and therefore a candidate for further examination? Dumping the output of odi_08.sql into Excel and adding a derived column rows/sec, and applying Colour Scales Conditional Formatting gives this:

Throughput analysis, using data from odi_08.sql

Looking at this and picking out two tasks that ran for about seven minutes, I’d be a lot more interested in “dummy task 13” which processed just over 2 million rows in that time, compared to “dummy task 2” which processed nearly seven times as many – 13 million. Now it may be one is doing a direct insert and the other’s doing some complicated merge logic, but it’s well worth checking before just heading for the biggest runtime numbers.

October 18, 2010

When is a bug not a bug? When it’s a “design decision”

Filed under: informatica, obia, rant, support — rmoff @ 13:02

Last month I wrote about a problem that Informatica as part of OBIA was causing us, wherein an expired database account would bring Oracle down by virtue of multiple connections from Informatica.

I raised an SR with Oracle (under OBIA support), who after some back-and-forth with Informatica, were told:

This is not a bug. That the two error messages coming back from Oracle are handled differently is the result of a design decision and as such not a product fault.

Is “design decision” the new “undocumented feature” ?

September 2, 2010

Misbehaving Informatica kills Oracle

Filed under: bug, informatica, obia, ORA-28001, oracle, security — rmoff @ 13:23

This problem, which in essence is bad behaviour from Informatica bringing down Oracle, is a good illustration of unintended consequences of an apparently innocuous security setting.
Per our company’s security standards, database passwords expire every 90 days. When this happens users are prompted to change their password before they can continue logging into Oracle. This applies to application user IDs too.
It appears that Informatica 8.6.1 HF6 (part of OBIA 7.9.6.1) doesn’t handle an expired password well, spawning multiple connections to the database, eventually bringing Oracle down through memory SWAP space exhaustion.

As a side note, one of our DBAs has been investigating how to prevent a client connection accidentally (through bad coding) or maliciously (DoS) bringing down Oracle in this way, his findings are documented here.

Investigation

As the introduction to any good IT horror story goes … “Everything was running fine; nothing had changed”.

Then our monitoring showed swap space usage on our Oracle 11g database server increasing, and soon after Oracle crashed. The DBAs restarted Oracle, but shortly after the swap space usage was on its way up. The unix tool Glance showed a lot of Oracle processes on the box.

Database

Our Informatica repository user expired on the day on which this happened (Aug 27th):

select username, account_status, expiry_date from dba_users

USERNAME                       ACCOUNT_STATUS                   EXPIRY_DATE
------------------------------ -------------------------------- ---------
INF_REPO                       EXPIRED                          27-AUG-10

When a user ID expires an ORA-28001 is given at login:

sqlplus INF_REPO/password

SQL*Plus: Release 11.1.0.7.0 - Production on Thu Sep 2 08:40:17 2010

Copyright (c) 1982, 2008, Oracle.  All rights reserved.

ERROR:
ORA-28001: the password has expired

Changing password for INF_REPO
New password:

This is the throughput figures for Oracle from Enterprise Manager, note the Logons rate starting to increase at c.13:30 (The rate at 03:00AM is representative of the usual logon load on the database):

Server

Note SWAP space increase (dark blue line) at c. midday (nb GMT/BST mean not all the graphs will align):

Database server metrics

Database server metrics

Note number of Alive Oracle processes (faint yellow line!):

Database server metrics - Oracle application only

Database server metrics - Oracle application only

Informatica

In the Informatica exceptions.log and node.log are the initial errors:

ERROR [Master Elect Data Writer] [DOM_10162] An exception occurred while updating the master election row.
java.sql.SQLException: [informatica][Oracle JDBC Driver]No more data available to read.

ERROR [Master Elect Data Writer] [DOM_10162] An exception occurred while updating the master election row.
java.sql.SQLException: [informatica][Oracle JDBC Driver][Oracle]ORA-01034: ORACLE not available
ORA-27101: shared memory realm does not exist
HPUX-ia64 Error: 2: No such file or directory

ERROR [Master Elect Data Writer] [DOM_10162] An exception occurred while updating the master election row.
java.sql.SQLException: [informatica][Oracle JDBC Driver][Oracle]ORA-28001: the password has expired

Followed by the repeated error approximately every ten seconds:

ERROR [Master Elect Data Writer] [DOM_10162] An exception occurred while updating the master election row.
java.sql.SQLException: [informatica][Oracle JDBC Driver][Oracle]ORA-28001: the password has expired

There are also final errors in the log, occuring once only just after midnight:

FATAL [Domain Monitor] [PCSF_10374] Failed to persist [CpuUsageSummary] with error [[informatica][Oracle JDBC Driver]No more data available to read.].
FATAL [Domain Monitor] [PCSF_10374] Failed to persist [RepoUsageSummary] with error [[informatica][Oracle JDBC Driver]No more data available to read.].

After these Informatica shut down.

Theory

This is what I think is happening:

  • Informatica has a polling component (“[Master Elect Data Writer]”) that updates a database table (part of the Informatica repository) every minute
  • Once the user has expired, Informatica gets ORA-28001: the password has expired when it tries to connect
  • Informatica does not handle ORA-28001 correctly
  • It appears that it leaves the connection open
  • It then retries a few seconds later
  • The connections stack up, each taking swap space allocated to the Oracle process that the connection spawns
  • Eventually the server runs out of resource and Oracle crashes
  • At midnight another Informatica component (“[Domain Monitor]”) tries to update a database table (part of the Informatica repository), and gets the ORA-28001 error.
  • This second component (“[Domain Monitor]”) correctly takes the error as fatal and aborts the Informatica server process

Resolution

In my opinion, Informatica should consistently treat ORA-28001 as fatal.

At the very least, if Informatica isn’t treating ORA-28001 as fatal it should close the connection to the database correctly.


An update from Informatica here

May 6, 2010

What am I missing here??? ORA-01017: invalid username/password; logon denied

Filed under: dac, ORA-01017, oracle — rmoff @ 17:01

What’s going on here? The username/password is definitely valid, proved by the sqlplus connection.

Configuring DAC in OBIA 7.9.5.1:

What can I do for you?

1 - Enter repository connection information
2 - Test repository connection
3 - Enter email account information
4 - Send test email
5 - Save changes
6 - Exit

Please make your selection: 1

These are your connection type choices:

1 - MSSQL
2 - DB2
3 - Oracle (OCI8)
4 - Oracle (Thin)
5 - Keep current ( Oracle (Thin) )

Please make your selection: 4

Current value for Instance is MYDB.
Press return to keep it or enter a new value.
> MYDB

Current value for Database Host is server.company.com.
Press return to keep it or enter a new value.
> server.company.com

Current value for Database Port is 1521.
Press return to keep it or enter a new value.
> 1521

Current value for Table owner name is DAC_REPO_795.
Press return to keep it or enter a new value.
> DAC_REPO_795

Press return to keep current password, enter a new value otherwise.
> HAS425Al

What can I do for you?

1 - Enter repository connection information
2 - Test repository connection
3 - Enter email account information
4 - Send test email
5 - Save changes
6 - Exit

Please make your selection: 2

Connecting to repository...
Can't connect to the database.
ORA-01017: invalid username/password; logon denied

Validate connectivity with SQLPLUS:

$sqlplus DAC_REPO_795/HAS425Al@MYDB

SQL*Plus: Release 10.2.0.1.0 - Production on Thu May 6 16:08:44 2010

Copyright (c) 1982, 2005, Oracle.  All rights reserved.

Connected to:
Oracle Database 11g Enterprise Edition Release 11.1.0.7.0 - 64bit Production
With the Partitioning, OLAP, Data Mining and Real Application Testing options

SQL>

Resolved by forcing the password to uppercase, but all our other DAC installations don’t require this, and this DAC installation connects with a mixed-case password to a different Oracle instance with no problem.

sys.aud$ shows the connection coming in, so I’m definitely hitting the correct Oracle instance with the correct username. Presumably the password is getting corrupted somewhere, but why, and why only in this particular instance??

What on earth am I missing???


Update:
Thanks for people’s comments.
1) All the databases are 11.1.0.7
2) All databases are sec_case_sensitive_logon = TRUE

The schema in question had been created through expdp/impdp of another schema on the same DB.

I’ve discovered an SR with similar symptoms for a different bit of Oracle software (SOA / OC4J), but in common both use JDBC drivers to connect to Oracle 11g.
I’m confident that the problem must lie in here somewhere, but cannot replicate it even with many different JDBC versions:
11.1.0.7
10.2.0.1.0
10.1.0.5.0
9.0.2.0.0

*scratches head*

October 12, 2009

OBIA 7.9.6.1 released

Filed under: informatica, obia — rmoff @ 07:47

The latest point release of Oracle Business Intelligence Applications, 7.9.6.1, has been released and is available for download from here (direct link to download).

The version.txt reports the version as:

Build: 7.9.6.1.100609.2038
Release Version: Oracle Business Intelligence Applications 7.9.6.1
Package: 100609.2038

No updated documentation library yet through, so can’t nosey through the release notes. The docs that come with the download are labelled 7.9.6 and dated April 09 so don’t look like they’ve been updated either.

————–

Update 13th Oct:
@alex has got the scoop on the new functionality. From this and the press release here’s a few snippets:

  • 28 supported languages
  • […] ideal for data warehouses running on the Sun Oracle Database Machine.
    • So I assume this means that it supports 11gR2 whether Exadata’d or not?
  • “adds support for Informatica PowerCenter 8.6.1 for ETL”
  • More supported DBs and OSs: IBM DB2 9.5 / Microsoft SQL Server 2008 / Teradata v13 / OEL 5 / IBM AIX 6.1 / Windows Server 2008 / RH Linux 5

Still no updated documentation on OTN. Never let it be said that the documentation lets OBIA down …. 😐
————–
Update 15th Oct:
Documentation is now available on OTN

August 14, 2009

Unix script to report on OBIEE and OBIA processes state

Filed under: Apache, cluster, dac, obia, obiee, sawserver, unix — rmoff @ 07:22

Here’s a set of scripts that I use on our servers as a quick way to check if the various BI components are up and running.

areservicesrunning

Because we split the stack across servers, there are different scripts called in combination. On our dev boxes we have everything and so the script calls all three sub-scripts, whereas on Production each server will run one of:

  1. BI Server
  2. Presentation Server & OAS
  3. Informatica & DAC

The scripts source another script called process_check.sh which I based on the common.sh script that comes with OBIEE.

The BI Server script includes logic to only check for the cluster controller if it’s running on a known clustered machine. This is because in our development environment we don’t cluster the BI Server.

Each script details where the log files and config files can be found, obviously for your installation these will vary. I should have used variables for these, but hey, what’s a hacky script if not imperfect 🙂

The script was written and tested on HP-UX.

Installation

Copy each of these onto your server in the same folder.

You might need to add that folder to your PATH.

Edit are_processes_running.sh so that it calls the appropriate scripts for the components you have installed.

You shouldn’t need to edit any of the other scripts except to update log and config paths.

The scripts

are_processes_running.sh

# are_processes_running.sh
# RNM 2009-04-21
# https://rnm1978.wordpress.com

clear
echo "=-=-=-=-=-=-=-=-=-=-=- "
echo " "

# Comment out the scripts that are not required
# For example if there is no ETL on this server then only
# run the first two scripts
_are_BI_processes_running.sh
_are_PS_processes_running.sh
_are_INF_processes_running.sh

echo " "
echo "=-=-=-=-=-=-=-=-=-=-=- "

_are_BI_processes_running.sh

# _are_BI_processes_running.sh
# RNM 2009-04-21
# https://rnm1978.wordpress.com

. process_check.sh

########## BI Server #################
echo "====="
if [ "$(is_process_running nqsserver)" = yes ]; then
  tput bold
  echo "nqsserver (BI Server) is running"
  tput rmso
else
  tput rev
  echo "nqsserver (BI Server) is not running"
  tput rmso
  echo "  To start it enter:"
  echo "    run-sa.sh start64"
fi
echo "  Log files:"
echo "    tail -n 50 -f /app/oracle/product/obiee/server/Log/NQServer.log"
echo "    tail -n 50 -f /app/oracle/product/obiee/server/Log/nqsserver.out.log"
echo "    tail -n 50 -f /app/oracle/product/obiee/server/Log/NQQuery.log"
echo "  Config file:"
echo "    view /app/oracle/product/obiee/server/Config/NQSConfig.INI"

echo "====="
if [ "$(is_process_running nqscheduler)" = yes ]; then
  tput bold
  echo "nqscheduler (BI Scheduler) is running"
  tput rmso
else
  tput rev
  echo "nqscheduler (BI Scheduler) is not running"
  tput rmso
  echo "  To start it enter:"
  echo "    run-sch.sh start64"
fi
echo "  Log files:"
echo "    tail -n 50 -f /app/oracle/product/obiee/server/Log/NQScheduler.log"
echo "    tail -n 50 -f /app/oracle/product/obiee/server/Log/nqscheduler.out.log"
echo "    ls -l /app/oracle/product/obiee/server/Log/iBots/"
echo "  Config file:"
echo "    view /data/bi/scheduler/config/instanceconfig.xml"

echo "====="
echo "$hostname"
if [ "$(hostname)" = "BICluster1" -o "$(hostname)" = "BICluster2" ]; then
  if [ "$(is_process_running nqsclustercontroller)" = yes ]; then
    tput bold
    echo "BI Cluster Controller is running"
    tput rmso
  else
    tput rev
    echo "BI Cluster Controller is not running"
    tput rmso
    echo "  To start it enter:"
    echo "    run-ccs.sh start64"
  fi
    echo "  Log files:"
  echo "    tail -n 50 -f /app/oracle/product/obiee/server/Log/NQCluster.log"
  echo "    tail -n 50 -f /app/oracle/product/obiee/server/Log/nqsclustercontroller.out.log"
  echo "  Config file:"
  echo "    view /app/oracle/product/obiee/server/Config/NQClusterConfig.INI"
else
  echo "(Not checked for Cluster Controller because not running on BICluster1 or BICluster2)"
fi

_are_PS_processes_running.sh

# _are_PS_processes_running.sh
# RNM 2009-04-21
# https://rnm1978.wordpress.com

. process_check.sh

########## OAS  #################
echo "====="
if [ "$(is_process_running httpd)" = yes ]; then
  tput bold
  echo "Apache (HTTP server) is running"
  tput rmso
else
  tput rev
  echo "Apache (HTTP server) is not running"
  tput rmso
  echo "  It should have been started as part of OAS. Check that opmn (Oracle Process Manager and Notification) is running"
  echo "  If opmn is running then run this command to check the status of the components:"
  echo "    opmnctl status -l"
  echo "  If opmn is not running then start it with this command:"
  echo "    opmnctl startall"
fi
echo "  Log files:"
echo "    ls -lrt /app/oracle/product/OAS_1013/Apache/Apache/logs"
echo "  Config file:"
echo "    view /app/oracle/product/OAS_1013/Apache/Apache/conf/httpd.conf"

echo "====="
if [ "$(is_process_running opmn)" = yes ]; then
  tput bold
  echo "opmn (OAS - Oracle Process Manager and Notification) is running"
  tput rmso
else
  tput rev
  echo "opmn (OAS - Oracle Process Manager and Notification) is not running"
  tput rmso
  echo "  To start it use this command:"
  echo "    opmnctl startall"
fi
echo "  Log files:"
echo "    ls -lrt /app/oracle/product/OAS_1013/opmn/logs"
echo "    ls -lrt /app/oracle/product/OAS_1013/j2ee/home/log"
echo "  Config file:"
echo "    view /app/oracle/product/OAS_1013/opmn/conf/opmn.xml"
echo "    view /app/oracle/product/OAS_1013/j2ee/home/config/server.xml"

########## Presentation Services #################
echo "====="
if [ "$(is_process_running javahost)" = yes ]; then
  tput bold
  echo "javahost is running"
  tput rmso
else
  tput rev
  echo "javahost is not running"
  tput rmso
  echo "  It is started as part of the sawserver startup script"
  echo "  To start it run this command:"
  echo "    run-saw.sh start64"
    echo "  To start it independently run this command:"
  echo "    /app/oracle/product/obiee/web/javahost/bin/run.sh"
  fi
echo "  Log files:"
echo "    ls -lrt /data/web/web/log/javahost/"
echo "  Config file:"
echo "    view /app/oracle/product/obiee/web/javahost/config/config.xml"

echo "====="
if [ "$(is_process_running sawserver)" = yes ]; then
  tput bold
  echo "sawserver (Presentation Services) is running"
  tput rmso
else
  tput rev
  echo "sawserver (Presentation Services) is not running"
  tput rmso
  echo "  To start it enter:"
  echo "    run-saw.sh start64"
fi
echo "  Log files:"
echo "    tail -n 50 -f /data/web/web/log/sawserver.out.log"
echo "    tail -n 50 -f /data/web/web/log/sawlog0.log"

echo "  Config file:"
echo "    view /data/web/web/config/instanceconfig.xml"
echo "    ls -l /data/web/web/config/"

_are_INF_processes_running.sh

# _are_INF_processes_running.sh
# RNM 2009-04-22
# https://rnm1978.wordpress.com

. process_check.sh

########## Informatica #################
echo "====="
inf_running=1
if [ "$(is_process_running server/bin/pmrepagent)" = yes ]; then
  tput bold
  echo "pmrepagent (Informatica Repository Server) is running"
  tput rmso
else
  tput rev
  echo "pmrepagent (Informatica Repository Server) is not running"
  tput rmso
  inf_running=0
fi
if [ "$(is_process_running server/bin/pmserver)" = yes ]; then
  tput bold
  echo "pmserver (Informatica Server) is running"
  tput rmso
else
  tput rev
  echo "pmserver (Informatica Server) is not running"
  tput rmso
  inf_running=0
fi
if [ "$inf_running" -eq 0 ]; then
  echo " "
  echo "  To start PowerCenter:"
  echo "    cd /app/oracle/product/informatica/server/tomcat/bin"
  echo "    infaservice.sh startup"
fi
echo " "
echo "  Log files (PowerCenter):"
echo "    ls -lrt /app/oracle/product/informatica/server/tomcat/logs"
echo " "
echo "  Log files (ETL jobs):"
echo "    ls -lrt /app/oracle/product/informatica/server/infa_shared/SessLogs"
echo "    ls -lrt /app/oracle/product/informatica/server/infa_shared/WorkflowLogs"

########## DAC #################

echo "====="
if [ "$(is_process_running com.siebel.etl.net.QServer)" = yes ]; then
  tput bold
  echo "DAC is running"
  tput rmso
else
  tput rev
  echo "DAC is not running"
  tput rmso
  echo " "
  echo "  To start the DAC server:"
  echo "    cd /app/oracle/product/informatica/DAC_Server/"
  echo "    nohup startserver.sh &"
  echo " "
fi
echo "  Log files:"
echo "    ls -lrt /app/oracle/product/informatica/DAC_Server/log"

process_check.sh

</pre>
# process_check.sh
# get_pid plagiarised from OBIEE common.sh
# RNM 2009-04-03
# RNM 2009-04-30 Exclude root processes (getting false positive from OpenView polling with process name)

get_pid ()
{
 echo `ps -ef| grep $1 | grep -v grep | grep -v "    root " | awk '{print $1}'` # the second grep excludes the grep process from matching itself, the third one is a hacky way to avoid root processes
}

is_process_running ()
{
process=$1
#echo $process
procid=`get_pid $process`
#echo $procid
if test "$procid" ; then
 echo "yes"
else
 echo "no"
fi
}

August 13, 2009

OBIA upgrade 7.9.5 to 7.9.6 – first thoughts

Filed under: bug, dac, obia, oracle — rmoff @ 13:05

We’re upgrading from OBIA 7.9.5 (Financials – GL) to OBIA 7.9.6. Our reasons are for support (7.9.5 does not support Oracle 11g) and minor functionality additions.

Our architecture is: HP-UX 64 bit Itanium (11.31), Oracle 11g (11.1.0.7), separate ETL server, 4x OBIEE servers (2x BI, 2xPS). We have no customisations in the ETL except something for budgets, which is superseded in 7.9.6.

This post is a semi-formed articulation of my frustrations encountered during an initial run through of the upgrade in a sandbox. As we progress with the upgrade I will post further, hopefully more useful, information on what we encounter.

Grumble

Oracle’s upgrade documentation is, in my opinion, not very good. Whilst I find the rest of their OBIA and OBIEE documentation in general clear and comprehensive, the OBIA upgrade document is ambiguous and completely lacking detail in areas.

There is probably also an element of failing to please all the punters all the time… OBIA is for so many different subject areas, so many potential technologies, that upgrade instructions maybe have to be generic.
If we had some highly-customised deployment on some obscure technology set then I would expect to have to work a lot out for myself, so my sense of frustration comes from using the most vanilla of vanilla – Oracle-everything, no customisations – yet still having to figure out so much for myself.

The upgrade document is a compendium of “see xxxx document for more details”. Anyone taking the upgrade half-seriously will invariably end up compiling their own version of instructions, copying-and-pasting the essence of the referenced documents into one place to produce their own upgrade instructions. This is good for understanding the process but leaves me feeling that I’m writing Oracle’s documentation for them. As a side-note to this, the HTML version of the upgrade guide doesn’t use hyperlinking to its many references to the installation guide!

“Upgrading Oracle BI Applications”

Ref: Page 6-1 of “Oracle® Business Intelligence Applications Upgrade Guide for Informatica PowerCenter Users”
This is so patently ridiculous. As I see it, OBIA is basically a combination of OBIEE, Informatica, DAC, etc etc – all individual components which are upgraded separately. Yet this section of the upgrade doc innocently states “Run the Oracle BI Applications installer to upgrade your Oracle BI Applications environment to the current version”. Simple as that! So once I’ve run the installer, my Oracle BI Applications environment will be at the “current version”, right? wrong, obviously.
What this actually installs is the bits and pieces that are the “money-shot” of OBIA — pre-built OBIEE RPD, pre-built DAC repository, pre-built Informatica repository.
OBIA is a confusing enough product, without stupid documentation like this. Maybe the marketeers or salesmen had a hand it, but OBIA is either the sum of the consituant parts (apps plus pre-built repositories), or it’s just the pre-built repositories, but it can’t be both.
It really should be called “Upgrade OBIA pre-built repositories” or something like that. Or provide an installer which does actually install all of OBIA….

Documentation errors

Out of date screenshots

Ref: p. 4-31 of Oracle® Business Intelligence Applications Installation Guide for Informatica PowerCenter Users
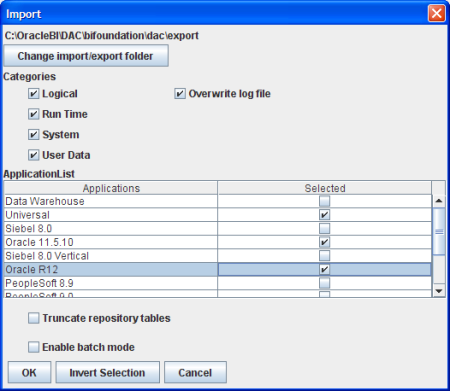
Screenshot is out of date, they’ve not updated the documentation for 7.9.6. Two category check boxes are missing, “User Data” and “Overwriten log file”

dacimpt01

Ref: To register Informatica Services in DAC / p. 4-33.
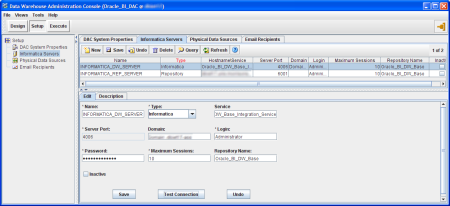
The screenshot is out of date, it doesn’t list the new Domain field:

dacconf01

Configuring Informatica Integration service in DAC

The documentation is wrong on this, as it does not take into account the DAC change of a new Domain field, and Server Hostname being replaced by Service. It also says to modify the record with Name = Oracle_BI_DW_Server, but by default the record has a name of INFORMATICA_DW_SERVER
Therefore when configuring this you need to set:

  • Service: The name of your Informatica Integration Service, eg. Oracle_BI_DW_Base_Integration_Service
  • Domain: The name of your Informatica Domain, eg. Domain_serverA

The rest of the fields as per the document.

Known bugs

Watch out for: 8723317 – unique constraint (DAC_REPO.W_ETL_SYSPROP_U1) violated when imported Metadata into the DAC repository

DAC and Informatica repositories

Your existing Informatica and DAC repositories are not upgraded.

The document says to “Rename and copy” your existing repositories. This comes under “Best practices for preparing to upgrade”. What it should say is you must either use new database schemas when you upgrade, or move your existing ones.
We used Oracle’s export/import to create copies of the existing repository schemas into new schemas (eg DAC_REPO to DAC_REPO_795), and then dropped and recreated the existing repository schema (eg DAC_REPO) so that they were empty to install to.
The upgrade doc simply doesn’t say to do this, or it misleadingly tells you to rename your Informatica repository, which in the context of an Informatica Repository is not possible.
If you don’t do this then you hit problems after the installation of DAC because you already have an existing repository which you get prompted to upgrade when you launch the client.

[edit] Actually – maybe your repositories are upgraded. It depends. You could upgrade your DAC repo in place and then Refresh Base from the new DAC repository metadata, or you can do it the other way around. You’d do the former if you had lots of customisations and the latter if you didn’t. [edit2] If you do the latter then you import a 7.9.5 version of the DAC repo, which throws lots of errors because tables changed in 7.9.6 with quite a lot of non-nullable columns added. Maybe you upgrade your 7.9.5 repository (you’re prompted to do so when you log in with the new DAC client), then export it, then import the new one and then refresh base on that? Or maybe if you’ve few customisations you just install a fresh 7.9.6 DAC repository and apply your few customisations to it manually?
It’s probably all patently obvious to a DAC/OBIA expert but about as clear as mud to someone just trying to figure it out just from the manuals.[/edit2]

It would be really helpful if this kind of thing didn’t have to be inferred and best-guessed from the documentation. Even if the doc just laid out the two approaches and left it to the user to chose the best. As it is the documentation states one method, or none at all. [/edit]

In summary …

If you’re doing an upgrade of OBIA then plan PLENTY of time for figuring out how it’ll work in your environment. Set up a sandbox you can play in and rollback, don’t assume you can follow the documentation sequentially and it all work nicely.

Oracle should be aiming to produce an Upgrade Guide as comprehensive as their Installation Guide. A product, especially an Enterprise one of this scale, is made up of more than its binaries. It is the binaries, the documentation, the support. An upgrade can be traumatic at the best of times – the documentation should give the user confidence to unleash it on their Production environment, not the feeling that one is half-guessing at the solution.

DAC repo your

July 23, 2009

Mark Rittman’s OBIEE repository for DAC

Filed under: dac, etl, obiee — rmoff @ 10:07

Mark Rittman has an excellent article about querying the DAC repository database tables, including a downloadable RPD file. Being new to working with RPDs I thought it would be good practise to explore this as well as hopefully get some useful information about our current ETL deployment.

I downloaded the RPD to c:\OracleBI\server\Repository and opened it up in the Admin tool (Administrator/Administrator).
First off I changed the connection pool to point to my DAC repository database, having setup a TNS entry for it first.

Then I had to rename the physical schema from DAC to DAC_REPO, and moved S_ETL_DAY from S_NQ_ACCT to DAC_REPO — both of these are just how our DBs laid out, YMMV

To test the connectivity I did Update Row Count over one of the tables, and got

There was an error while updating row count for “ORCL”..”DAC_REPO”.”S_ETL_DAY”:
[nQSError: 17001] Oracle Error code:942, message: ORA-00942: table or view does not exist …

I’d already checked where the tables did reside through SQL Developer:
Since my connection was defined with a user other than the schema owner (DAC_REPO), I figured it was maybe not qualifying the table name, so found this in the connection pool settings:
I could then update the row counts, with the following exceptions which are columns defined in the RPD but not present in my DAC repository schema (v7.9.5.1):
W_ETL_FOLDER.PRIORITY, W_ETL_RUN_STEP.GROUP_NAME and W_ETL_RUN_STEP.RUN_MODE

I deleted these from the Physical layer, hoping that it would warn me if they’re used in the BMM or Presentation layer. It didn’t – but running a Global Consistency Check warned me that Run Mode is used in the Task Runs logical table, so I deleted it from there too.

I saved the RPD and change my NQServer.config to point to it:
Starting up BI Server I got an error:

2009-07-23 11:47:45 [nQSError: 26011] File C:\OracleBI\server\Config\NQSConfig.INI Near Line 30, near : Syntax error [nQSError: 26012] .

So I guess it’s not happy with the spaces in the filename. I changed it to

Star = “DAC Analysis.rpd”, DEFAULT;

and it starts up fine. I then got an error trying to log into Answers:

Error connecting to the Oracle BI Server: The specified ODBC DSN is referencing a subject area that no longer exists within the Oracle BI Repository.

State: 08004. Code: 10018. [NQODBC] [SQL_STATE: 08004] [nQSError: 10018] Access for the requested connection is refused. [nQSError: 43037] Invalid catalog, Sample Sales, specified. (08004)

(I like the fact that Presentation Services parses the ODBC error into something more intelligable. I’d have eventually figured it out from the ODBC error, but being told up front what the problem is doesn’t happen enough with computer errors:) )

This happened because in my system DSN (pointed to in the Presentation Services instanceconfig.xml) I had checked the “Change default catalog to” box, and it was trying to find SampleSales in the repository when it didn’t exist.
Unticking this box finally let me log in

On a specific point, the “# Succesful” and “# Failed” measures in Task Runs refer to the number of rows, not number of tasks as it could be interpreted.

The RPD is described by Mark Rittman as:

[…] no means finished or error tested, but if you want to see how I put the example together, feel free to download it and see how it’s put together.[…]

and this is a fair description of it. It’s a great starting point which has done a lot of the hard work, and it is very useful as a head-start for understanding the DAC repository tables.
However, it would be wrong to think of it as an out-the-box solution for super-fancy reporting against the DAC. Realistically you still need to understand the tables and data that you’re analysing otherwise you’ll come up with misleading or plain wrong reports.
But that said, if you have a DAC deployment that you maybe want to do some serious performance work with and want a way to visualise what’s going on in your batch, this is a great starting place.

Older Posts »

Create a free website or blog at WordPress.com.