rmoff

July 30, 2009

What is OBIA…

Filed under: obia, obiee — rmoff @ 07:45

Very good post by @lex giving a nice clear explanation of what OBIA (Oracle Business Intelligence Applications) is

http://siebel-essentials.blogspot.com/2009/06/can-you-describe-oracle-bi-applications.html

This should be made a sticky on the OBIA forum in my opinion.

It’s clear from postings on the forum that an awful lot of people don’t understand what OBIA is or how it sits with OBIEE. I even attended a course last week in which the Oracle trainer stated that OBIEE included ETL and DW schemas, and stuck to this when challenged.

Part of people’s confusion will be from their reluctance to RTFM, but the sheer confusion suggests that Oracle have some way to go in clearly defining their BI toolset.

[edit]

This is my definition of OBIA…

OBIEE + Informatica + DAC + metadata bits + a sprinkle of fairy dust = OBIA

[/edit]

July 29, 2009

OBIEE performance monitoring and alerting with jManage

Filed under: jManage, jmx, monitoring, obiee, performance, systemsmanagement — rmoff @ 10:47

OBIEE’s Systems Management component exposes configuration and performance data through Java MBeans. As discussed in other posts these can be be accessed through several different ways:

Since it’s a standard java technology being used we can in theory use anything that is designed for monitoring mbeans via jmx. Doing some Googling I discovered jManage.

jmanage13

JManage (homepage / SourceForge project page) describes itself thus:

jManage 2.0 is an open source application management platform, which provides a centralized console for managing application clusters and distributed-application environments

The latest version is a Release Candidate (RC) from 2007, and whilst the website’s forum isn’t entirely a ghost town it’s evidently not in active development.

Installing JManage on Windows

(This is a bare-bones installaion and what I did to get something up and running – it is probably not how it should be done)

  1. Download from SourceForge
  2. Unzip the downloaded archive somewhere
  3. From the command line run bin/startup.cmd
  4. Enter the default password 123456 when prompted
  5. Assuming you don’t get any errors go to http://localhost:9090/ where you should get a login page.
  6. Login at admin / 123456
  7. You should get a list of Managed Applications with one entry, jManage

    Default jManage homepage

    Default jManage homepage

Adding OBIEE to jManage

NB: If you have separate BI and PS servers you’ll need to monitor both, as the performance data is local

  1. This assumes that you installed Systems Management when you installed OBIEE. If in doubt have a look for [OracleBI home]/systemsmanagement
  2. In [OracleBI home]/systemsmanagement edit the runagent.cmd (or .sh if it’s a unix installation) to make the data accessible remotely as follows:

    On the java_cmd line replace
    -Dcom.sun.management.jmxremote
    with
    -Dcom.sun.management.jmxremote -Dcom.sun.management.jmxremote.port=9980 -Dcom.sun.management.jmxremote.authenticate=false -Dcom.sun.management.jmxremote.ssl=false

    (See here for more information on configuring jmx)

  3. Start the agent by running runagent.cmd (or .sh if it’s a unix installation). You should get this kind of output:
    [...]
    ========================================
    Analytics JMX Agent
    ========================================
    Started...
    29-Jul-2009 09:01:32 oracle.bi.analytics.management.monitoring.AppPerfMon refresh
    INFO: Oracle BI Presentation Server has started. Perfcounter data is collected.
    29-Jul-2009 09:01:32 oracle.bi.analytics.management.monitoring.AppPerfMon refresh
    INFO: Oracle BI Server has started. Perfcounter data is collected.
  4. If you want to be sure it’s working, use jconsole to connect and examine the MBeans exposed. See here for more information
  5. In jManage click on Add Application (if you can’t see this make sure you’re on the http://localhost:9090/config/managedApplications.do page)
  6. Choose JSR160 as Application Type
  7. Enter a description name for your server, and then for the URL this:

    service:jmx:rmi:///jndi/rmi://YourServer:9980/jmxrmi

    (nb 9980 is the port specified in the runagent.cmd script, so change this if need be)

  8. Leave Username, Password, java.naming.factory.initial and java.naming.provider.url as they default to on the formjmanage02
  9. Click Save
  10. If it’s worked then you should be back at the Managed Applications page with your server listed and hopefully a green icon next to it, indicating that jManage has successfully connectedjmanage03

NB: There seems to be a bug in adding an application to jManage which might catch you out. If you copy and paste the service URL you get a space appended to the end, which means your application gets added but jManage can’t connect to it (so lists it as down / red icon). If you examine the console you’ll see this:

29-Jul-2009 11:07:27 org.jmanage.core.management.ServerConnector getServerConnection
INFO: Failed to connect. error=Failed to retrieve RMIServer stub: javax.naming.NameNotFoun
dException: jmxrmi

If you edit the application to remove the trailing space from the URL you’ll see in the console that it doesn’t retry the URL, so I’m guessing doesn’t register the removal of the space.
The workaround is to delete the application and re-add it, being careful not to include the trailing space.

Exploring jManage & OBIEE

Current performance numbers

From the application page, enter click on Find Managed Objects (leaving the filter as *:*). You’ll get a list of MBeans which will be familiar if you’ve already explored MBeans through jconsole or oc4j.

Click on like Oracle BI=Performance,AppName=Oracle BI Presentation Server,name=Oracle BI PS Sessions and you’ll get a list of the current values of session metrics within Presentation Services
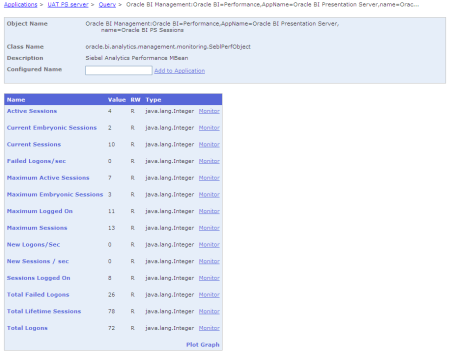
jmanage05

Graphing performance

Now click on Plot Graph (bottom right corner of the metrics list box) and tick a handful of metrics to graph. Click on Next. Enter a name for the graph and a polling interval, and click on Save.

You’ll get taken back to the main application page, where you should now have Graphs box, with your newly created graph listed underneath. Click on the graph name.

jmanage07

You’ll get a java applet firing up for the graphing. The graph applet has a context menu (right click) through which you can customise its appearance.
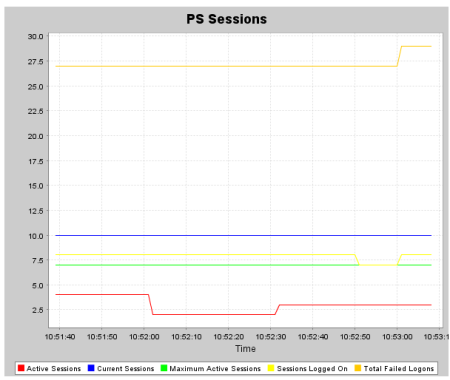
jmanage08

You can graph across metric groups (eg. Sessions and Cache) by selecting Add Graph from the main application page.

See here for jManage graph reference

NB: You might get a blank graph (with no legend for the metrics you selected). If this is the case then go back to the command window where you started jManage from and you’ll probably see an error:

29-Jul-2009 10:41:38 org.mortbay.jetty.servlet.ServletHandler handle
WARNING: Error for /app/fetchAttributeValues.do;jsessionid=2an2geo5rpuib
java.lang.AssertionError
        at org.jmanage.webui.actions.app.MBeanAttributeValuesAction.execute(MBeanAttribute
ValuesAction.java:76)

This highlights that jManage is not a finished product (nor does it claim to be), so bear this in mind when considering investing time in it.
It looks like in this instance the New Logons/Sec object was causing the failure, and it’s the only one with a value of zero so maybe that caused the error?? But another object, Completed Requests/sec, has a value of zero but graphs successfully.
Looking at the output of runagent.cmd shows:

java.lang.NullPointerException
        at oracle.bi.analytics.management.monitoring.SeblPerfObject.getAttribute(SeblPerfObject.java:371)
        at oracle.bi.analytics.management.monitoring.SeblPerfObject.getAttributes(SeblPerfObject.java:510)
        at oracle.bi.analytics.management.monitoring.SeblPerfObjectInstanceMBean.getAttributes(SeblPerfObjectInstanceMBean.java:148)
        at com.sun.jmx.mbeanserver.DynamicMetaDataImpl.getAttributes(DynamicMetaDataImpl.java:125)
        at com.sun.jmx.mbeanserver.MetaDataImpl.getAttributes(MetaDataImpl.java:189)
        at com.sun.jmx.interceptor.DefaultMBeanServerInterceptor.getAttributes(DefaultMBeanServerInterceptor.java:696)
        at com.sun.jmx.mbeanserver.JmxMBeanServer.getAttributes(JmxMBeanServer.java:686)
        at javax.management.remote.rmi.RMIConnectionImpl.doOperation(RMIConnectionImpl.java:1389)
[...]

So to be fair to jManage it could be that OBIEE’s systems management isn’t honouring the exposed metric, but it would be nice if jManage ignored it and still showed the others, or flagged up the error.

Managed Objects

I think Managed Objects are a way of “bookmarking” specific MBeans for faster access from the dashboard for querying current values and defining graphs or alerts.
For example, the object detailing performance data about our data warehouse connection pool, Oracle BI=Performance,AppName=Oracle BI Server,type=Oracle BI DB Connection Pool,name=Star_Oracle Data Warehouse_Oracle Data Warehouse Connection Pool, is going to be of more interest than all the Configuration objects, plus a bunch of performance objects that we probably won’t examine too closely that often.
From the application page, click on Add Managed Object. Enter a display name next to the object(s) you’re interested in, and click on Add (at the bottom of the page).
jManage Management Console_1248864159305
Your new object is displayed on the application home page:
jmanage15
from where you can click through to see the current metric values, and define a graph or alerts.

Alerting

You can define alerts which will fire to email and/or the jManage home page:
jmanage09
To do this click on Add Alert from the application page, or Monitor when browsing the Management Objects
jmanage10

jmanage11

To use email alerts you need to update the Email properties section of jmanage.properties in the bin folder of jManage.

Application Clustering

Application Clustering is useful for defining groups of applications. They don’t have to actually be clustered. To set it up click on Add Application Cluster from http://localhost:9090/config/managedApplications.do

jmanage14
The status of an application filters up, so for example if the BI server is marked as down then the parent application cluster is also marked as down.

This Clustering feature is very useful for being able to see side-by-side metrics from multiple OBIEE nodes:
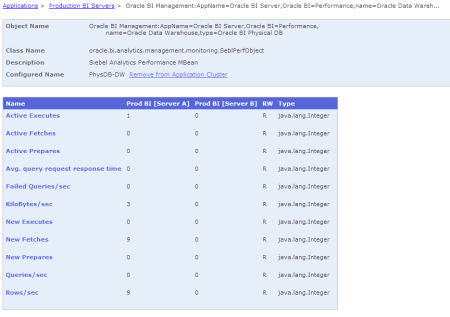
jmanage16

If graphing could be done at a cluster level that’d be even better 🙂 (per this feature request)

Configuration

As well as performance data, OBIEE Systems Management mbeans expose all the configuration options. You can edit this through jManage (just as you can through jconsole or oc4j), but bare in mine that no backups are taken of the config files so you should be cautious when using this.

Further info

jManage documentation: http://www.jmanage.org/wiki/index.php/Documentation
Errors are logged to the console and also logs/error.log in the jManage folder.

Further thoughts

The documentation details Dashboard development so it might be possible to build up a half-decent dashboard for assessing the overall OBIEE performance & status at a high level.

Threshold alerts on OBIEE mbeans could be logged and picked up by an enterprise systems management tool (although hopefully that tool could interface with jmx and the mbeans directly?)

The command line mode could be a way of extracting performance mbean values, although would a direct native java application be more appropriate for anything other than experimentation?

The graphing functionality in jManage – which would be one of the main reasons for using this instead of oc4j or jconsole for looking at the point-in-time numbers – is immature with frustrations like not being able add or remove metrics from an existing graph.

Bottom line

Whilst an unfinished product, jManage gives an interesting option to extending OBIEE performance monitoring and alerting. However, the BI Management Pack for Enterprise Manager is obviously the proper way to monitor OBIEE at the Enterprise level, and there’d have to be a really good reason to use jManage for monitoring OBIEE in anything other than an exploratory manner.

July 28, 2009

How to find out what web application server is in use

Filed under: OAS, obiee, sawserver — rmoff @ 12:06

If, for some reason, you need to check what web application server is in use for Presentation Services (as this chap needed to), you can use an add-in for FireFox called HttpFox to inspect the HTTP headers.

1. Install HttpFox (and obviously Firefox if you don’t have it already!)
2. Open the HttpFox window (Tools -> HttpFox -> Toggle HttpFox)
3. Click the Start button in the HttpFox window
4. Navigate to your OBIEE home page
5. Click the Stop button in the HttpFox window
6. Click on the first entry in the list, URL should be http://yourserver:7777/analytics/saw.dll?Dashboard
7. In the right-hand pane of the Headers tab you should see Server listed. In this instance, it’s Oracle-Application-Server-10g/10.1.3.1.0 Oracle-HTTP-Server

Maker’s Schedule, Manager’s Schedule

Filed under: timemanagement — rmoff @ 08:29

I found this post very interesting: Paul Graham : Maker’s Schedule, Manager’s Schedule (originally found here)

It was one of those mini-revelations when I found something that greatly resonated and explained an inexplicable frustration I find in the workplace sometimes.

I wonder how applicable it can be to a large corporation though, rather than a start-up where it’s given that people are allowed to be bolshy with their meetings? 😉

July 27, 2009

ORA-00922: missing or invalid option

Filed under: ORA-00922, oracle — rmoff @ 16:26

We routinely change Oracle passwords as part of security best-practice, I keep hitting this and keep forgetting why! 🙂

ALTER USER DAC_REPO IDENTIFIED BY 1KoBe3RH REPLACE YlR94tqp

Error report:
SQL Error: ORA-00922: missing or invalid option
00922. 00000 – “missing or invalid option”
*Cause:
*Action:

Someone better qualified than me can explain why but I suspect it’s the leading number in the new password. Quoting the passwords then works fine:

ALTER USER DAC_REPO IDENTIFIED BY "1KoBe3RH" REPLACE "YlR94tqp"

ALTER USER DAC_REPO succeeded.

July 24, 2009

OBIEE Windows PerfMon counters

Filed under: hack, obiee, performance, windows — rmoff @ 10:30

Yet another way to access the BI Management data discussed here – through Windows’ PerfMon tool.

This will only work for installations where your OBIEE server is running on Windows. You should be able to run PerfMon locally or remotely. Standard practise would be not to run it locally on a Production machine 🙂

To run PerfMon go to Start->Run and enter perfmon, or navigate Start -> Settings -> Control Panel -> Administrative Tools -> Performance

By default a handful of metrics about your local machine are displayed:

Right click and Add Counters:
If you want to monitor a remote installation of OBIEE (on Windows only, remember) then enter the network name eg \\MYREMOTESERVER in ‘Select counters from Computer:’, otherwise set this to ‘Use local computer counters’.

Then click on Performance object dropdown, and you should see a long list of Oracle BI performance objects:
Pick one of these and a list of counters within the object will be listed. You can add all, some or just one of these.

By default the Performance Counters are installed I think, but both NQSServer.exe and sawserver.exe have commandline options for reinstalling them (or uninstalling, if you want to):

NQSServer.exe /installperf
NQSServer.exe /uninstallperf

sawserver.exe /installperf
sawserver.exe /uninstallperf

PerfMon is documented well elsewhere on the web so I won’t say much more other than that you can use it interactively or logging to file. The latter would be very useful for trending of performance data, you could even go full circle and analyse it with Answers 🙂

Final thought is that exposing the data this way is very helpful for Systems Management, as you now have the option of using MOM/SCOM, etc to monitor and alert on your BI servers.

I would imagine some or all of the above functionality is also available through the BI Management Pack for Enterprise Manager, but this is another way to skin the cat.

Metalink 3 – Do You Mean … ?

Filed under: metalink, silly, support — rmoff @ 08:42

One of my little gripes with Metalink is its purporting to be helpful when it’s blatantly not. Here’s one:

Now which is more likely, on Metalink 3; that I’m searching for sawserver (integral component to OBIEE), or sqlserver?!

July 23, 2009

sawserver logging configuration – logconfig.xml

Filed under: config, hack, log, sawserver — rmoff @ 17:40

The configuration of how Presentation Services (sawserver) does its logging is in the file web/config/logconfig.xml (same directory as instanceconfig.xml).

It’s all nice and XML’d:


Logging Detail
Change the numerical values in the FilterRecord entries to alter the detail level of the logging. Lower means less detail, higher means more.

Be aware that your log files can grow very rapidly if you set the logging too high, and unless you’re troubleshooting then leave them at the defaults.

Logging Configuration
You can change various things like how many log files are written, to what size, and also the format of the log entries:
This configuration is in the Writer definition, in the case of format set fmtName=”short”
Being able to write a single-line entry is very useful in the case of monitoring software (eg. OpenView) which can’t parse multiple line log entries.

sawserver.out.log and saw[x].log
sawserver.out.log is the stdout logging from presentation services. In Unix this is captured to sawserver.out.log, whereas in Windows I don’t think it’s captured.
saw[x].log is the file logging from presentation services

The level of information for both files is defined in logconfig.xml:

<filterrecord writerclassgroup=”Cout” path = “saw” information=”31″ warning=”41″ error=”41″ security=”41″>
<filterrecord writerclassgroup=”File” path = “saw” information=”31″ warning=”100″ error=”100″ security=”41″>

So by default you’ll more detail in your saw[x].log (writerClassGroup=”File”) than sawserver.out.log (the redirected stdout, writerClassGroup=”Cout”). In sawserver.out.log you’ll get the same Information and Security type messages as saw[x].log, but fewer (only those of greater severity) Warning and Error type messages.

More detail
See Presentation Services Administration Guide “Using the Oracle BI Presentation Services Logging Facility” for more very detailed information.

psservice – Windows command line goodness!

Filed under: hack, obiee, sawserver, services, windows — rmoff @ 16:51

Our main servers are Unix and I’m as happy as a pig in muck at the command line, so when I’m working on Windows (where I’ve got a test OBIEE install) I like to stick with the CLI where possible.

PSService is one of those tools that I instinctively reach for without realising it. Combined with Launchy, it’s even better.

Simply put, you can control windows services from the command line.

So to restart Presentation Services, instead of

Start -> Settings -> Control Panel -> Administrative Tools -> Services, scroll down, find service, right click, select restart,

I do

alt-space -> cmd [tab] psservice restart sawsvc

You can query service statuses, and for multiple services at a time:

C:\Windows\System32>psservice query "Oracle BI"
PsService v2.21 - Service information and configuration utility
Copyright (C) 2001-2006 Mark Russinovich
Sysinternals - www.sysinternals.com

SERVICE_NAME: Oracle BI Cluster Controller
DISPLAY_NAME: Oracle BI Cluster Controller
(null)
TYPE : 10 WIN32_OWN_PROCESS
STATE : 1 STOPPED
(NOT_STOPPABLE,NOT_PAUSABLE,IGNORES_SHUTDOWN)
WIN32_EXIT_CODE : 1077 (0x435)
SERVICE_EXIT_CODE : 0 (0x0)
CHECKPOINT : 0x0
WAIT_HINT : 0x0

SERVICE_NAME: Oracle BI Scheduler
DISPLAY_NAME: Oracle BI Scheduler
(null)
TYPE : 10 WIN32_OWN_PROCESS
STATE : 1 STOPPED
(NOT_STOPPABLE,NOT_PAUSABLE,IGNORES_SHUTDOWN)
WIN32_EXIT_CODE : 1077 (0x435)
SERVICE_EXIT_CODE : 0 (0x0)
CHECKPOINT : 0x0
WAIT_HINT : 0x0

SERVICE_NAME: Oracle BI Server
DISPLAY_NAME: Oracle BI Server
(null)
TYPE : 10 WIN32_OWN_PROCESS
STATE : 4 RUNNING
(STOPPABLE,NOT_PAUSABLE,ACCEPTS_SHUTDOWN)
WIN32_EXIT_CODE : 0 (0x0)
SERVICE_EXIT_CODE : 0 (0x0)
CHECKPOINT : 0x0
WAIT_HINT : 0x0

SERVICE_NAME: sawjavahostsvc
DISPLAY_NAME: Oracle BI Java Host
(null)
TYPE : 10 WIN32_OWN_PROCESS
STATE : 4 RUNNING
(STOPPABLE,NOT_PAUSABLE,ACCEPTS_SHUTDOWN)
WIN32_EXIT_CODE : 0 (0x0)
SERVICE_EXIT_CODE : 0 (0x0)
CHECKPOINT : 0x0
WAIT_HINT : 0x0

SERVICE_NAME: sawsvc
DISPLAY_NAME: Oracle BI Presentation Server
(null)
TYPE : 10 WIN32_OWN_PROCESS
STATE : 4 RUNNING
(STOPPABLE,NOT_PAUSABLE,ACCEPTS_SHUTDOWN)
WIN32_EXIT_CODE : 0 (0x0)
SERVICE_EXIT_CODE : 0 (0x0)
CHECKPOINT : 0x0
WAIT_HINT : 0x0

PSService can be run remotely too, so you could use it for remote administration of your servers.

You can get full syntax from psservice -help

Services can be referenced by either their name (sawsvc) or display name (Oracle BI Presentation Server)

BTW if you like this kind of thing and work with Windows rather than Unix, check out Microsoft’s PowerShell – it’s one of the few things I’ve missed since moving back to working primarily with Unix! 😀 (I don’t mean that in a Microsoft-bashing way, just that it’s really satisfying to work with)

[Edit]
You can also use the builtin net command for controlling services, but it’s not as functional as psservice
[/edit]

sawserver charts crash

Filed under: bug, obiee, sawserver — rmoff @ 15:31

By a strange co-incidence after following this thread on OTN forums about a BI crash and struggling to understand the actual problem, I think I’ve encountered it myself!

I’ve got a test install of OBIEE running on my Windows XP laptop, and whilst building a report in Answers got this:

The “Error signature” (brings to mind fountain pens and blotting pads) was:

szAppName : sawserver.exe szAppVer : 10.1.3.4 szModName : kernel32.dll
szModVer : 5.1.2600.3119 offset : 000097a3

Going to the sawserver log at c:\OracleBIData\web\log\sawlog0.log disappointingly showed no error entries 😦

A suggestion here of a bug but it relates to pivot tables, which I wasn’t doing.

[update]
I’ve been able to reproduce this error. It’s on a report with a table and chart. It works fine with the original dataset of 97 rows returned, but when I remove a filter and 22,000 rows are returned sawserver barfs when rendering it.

I’ve increased the logging level in sawserver, but still can’t see anything helpful in the log.

It’s definitely something to do with the chart, because I’ve now whittled the report down to just the chart and the large dataset query, and it crashes PS every time it’s run.

I’ve upped the javahost logging (see [OracleBI]\web\javahost\config\logconfig.txt), nothing to be seen there. I dug around in CORDA, the chart generation software, but failed to get any logs out.

The only bit of firm diagnostic is that when a chart is successfully rendered there are two files created in C:\WINDOWS\TEMP:
Charts_150001_63825.javahost.in
Charts_150001_63825.javahost.out
(where 150001_63825 varies). The .in file is XML, I think as sent to Corda for rendering. The .out I binary and I assume is the flash file.
When I run my dodgy report, neither of these two files gets created. For successful charts the javahost log shows:

23-Jul-2009 23:30:33 ChartRpcCall processMessage
INFO: Saved request to C:\WINDOWS\TEMP\Charts_150001_63825.javahost.in. Saving response to C:\WINDOWS\TEMP\Charts_150001_63825.javahost.out

In the javahost log is a WARNING: Unexpected exception. Connection will be closed message, presumably from sawserver barfing out and dropping the connection.

So if the sawserver “sends” graphs to corda via javahost, and javahost isn’t logging the request -and it’s sawserver process that’s crashing- the fault’s presumably somewhere in sawserver, my guess is when it tries to render a chart with too many data points?
[/update]

[update 2]
After upgrading to 10.1.3.4.1 I now get this error displayed in Answers when I try to render the chart:

A fatal error occurred while processing the request. The server responded with: Error while executing ChartRpcCall.processMessage com.siebel.analytics.utils.InputStreamWithLimit$ReadOverTheLimitException at com.siebel.analytics.utils.InputStreamWithLimit.incTotalBytes(InputStreamWithLimit.java:58) at com.siebel.analytics.utils.InputStreamWithLimit.read(InputStreamWithLimit.java:41) at com.siebel.analytics.utils.IOUtils.copyStreams(IOUtils.java:38) at com.siebel.analytics.utils.IOUtils.copyStreams(IOUtils.java:28) at com.siebel.analytics.web.javahostrpccalls.corda.ChartRpcCall.ensureSafeAttrs(ChartRpcCall.java:84) at com.siebel.analytics.web.javahostrpccalls.corda.ChartRpcCall.processUnidi(ChartRpcCall.java:225) at com.siebel.analytics.web.javahostrpccalls.corda.ChartRpcCall.processMessageInternal(ChartRpcCall.java:265) at com.siebel.analytics.javahost.AbstractRpcCall.processMessage(AbstractRpcCall.java:107) at com.siebel.analytics.javahost.MessageProcessorImpl.processMessage(MessageProcessorImpl.java:175) at com.siebel.analytics.javahost.Listener$Job.run(Listener.java:223) at com.siebel.analytics.javahost.standalone.SAJobManagerImpl.threadMain(SAJobManagerImpl.java:205) at com.siebel.analytics.javahost.standalone.SAJobManagerImpl$1.run(SAJobManagerImpl.java:153) at java.lang.Thread.run(Thread.java:619) .
Error Codes: AGEGTYVF
Older Posts »

Create a free website or blog at WordPress.com.