rmoff

October 10, 2011

Instrumenting OBIEE – the final chapter


This article has been superseded by a newer version: Instrumenting OBIEE Database Connections For Improved Performance Diagnostics


(Previously on this blog: 1, 2, 3)

Summary

Instrument your code.
Stop guessing.
Make your DBA happy.
Make your life as a BI Admin easier.

The Problem

OBIEE will typically connect to the database using a generic application account.
(Hopefully, you’ll have isolated it to an account used only for this purpose – if you haven’t, you should.)

The problem is that you lose a lot of visibility of work both up and down the stack.

  • An OBIEE query is causing a problem on the database – how do you identify the originator?
  • You want to investigate the performance of an OBIEE query, but how do you identify which DB session it is?
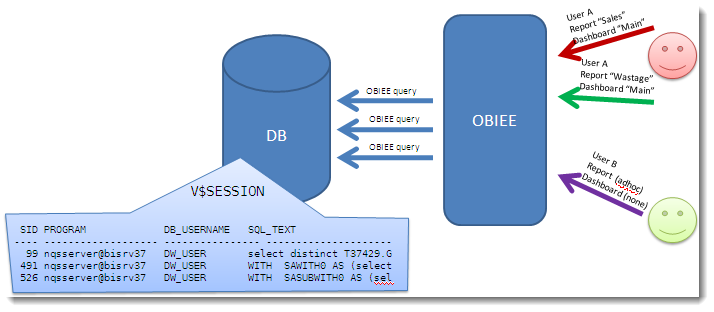
We know SID 491 is causing a problem, but how do we identify the originating OBIEE user?

You could start piecing together Usage Tracking and NQQuery.log files, but it’s hardly convenient or instantaneous is it?

The solution

By taking advantage of native Oracle procedures, we can instrument our OBIEE code to pass through lots of valuable information:
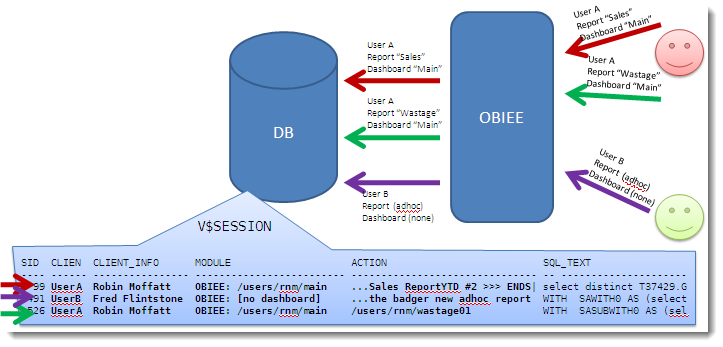
Now we can see which OBIEE user fired the query resulting in SID 491, and not only the user, but the dashboard and request name they are running.

This works in both OBIEE 10g and 11g.

See my previous post here for further background, and discussion of the procedures used.

Implementing it – overview

In essence, we harness internal OBIEE session variables which hold the user ID, name, dashboard and report name. We put a set of database calls on the connection pool(s) associated with query requests.

We have to do a bit of trickery to work around two issues.

Firstly, the variables may not be set (you may not have saved your new request yet, or may be running it outside of a dashboard). To get around this, we create two dummy session variables with the same names, and populate them with dummy init blocks.

Secondly, there is a limitation to the number of characters that can be passed through, and so we manipulate the string if necessary to use the right-most characters.

Implementing it – Init Block and Dummy Variables

Summary:

Create two init block/session variable pairs:

Session Variables

Initialisation Blocks

Be sure to use a connection pool which isn’t used for queries.

Step-by-step

Load up your RPD. If you haven’t already, create a new connection pool that is just for these init blocks. It can be to any database – in the examples below it’s an Oracle one, but any that supports selecting from a dummy table like DUAL in Oracle.

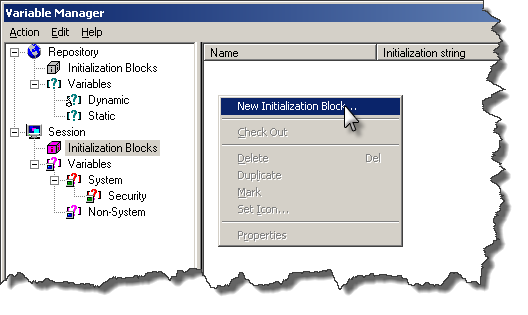
Go to Manage -> Variables, click on Session -> Initialisation Blocks. Right click in the section to the right, and select New Initialization Block.
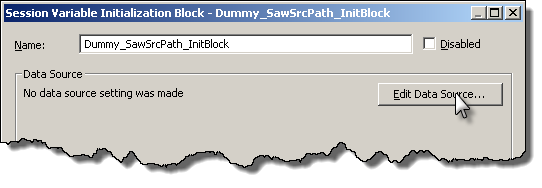
Call the init block Dummy_SawSrcPath_InitBlock, and then click on “Edit Data Source”
Set the Data Source Type to Database, and the init string to

select '[unsaved request]' from dual

Click on Browse to set the Connection Pool used. The connection pool should be one exclusively for init blocks (not the same you use for queries). If you try to use the same connection pool as for queries, you’ll most likely get an error when you logon.

Once you’ve set the connection pool, click on Test – you should get a result as shown:
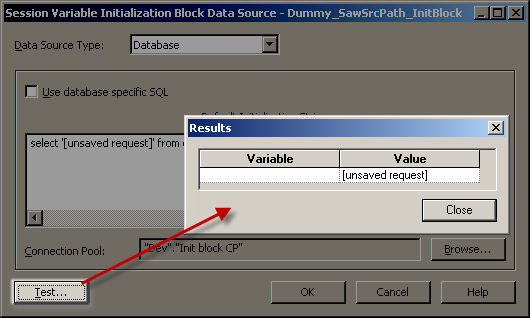
If the Test doesn’t succeed then you need to fix the problem before you continue.

Assuming it’s worked, click OK to return to the Init Block creation window. We now want to define the dummy variable, so to do so click on “Edit Data Target”:
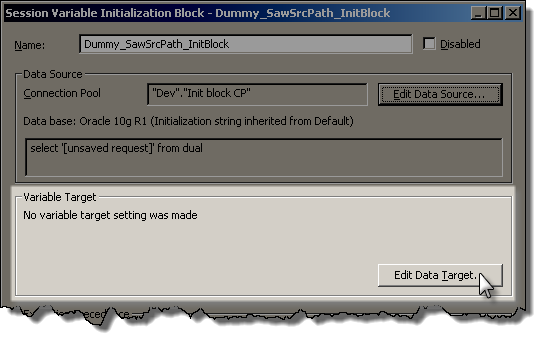
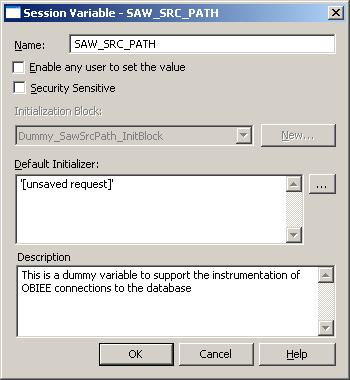
Click on New to create a new variable, and give it the name SAW_SRC_PATH. Make sure you get the name exactly correct, no typos.
Give it a default initializer, and then click OK.
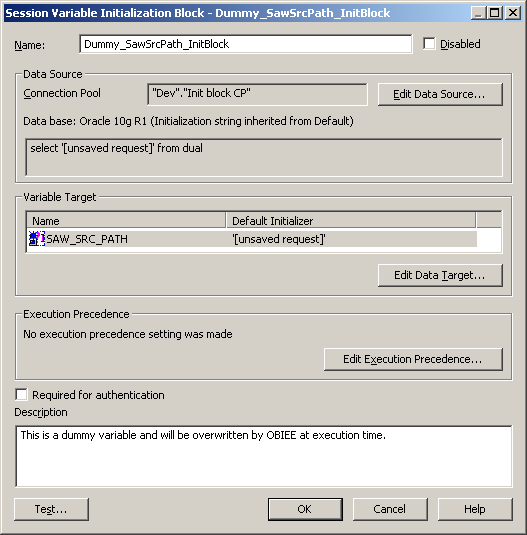
Make sure your init block setup now looks like this:
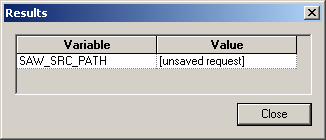
Click on Test, and expect to get this returned:
Assuming it works, then click OK to save the new Init Block and Variable.

Repeat as above to create an init block/variable pair for SAW_DASHBOARD, looking like this:
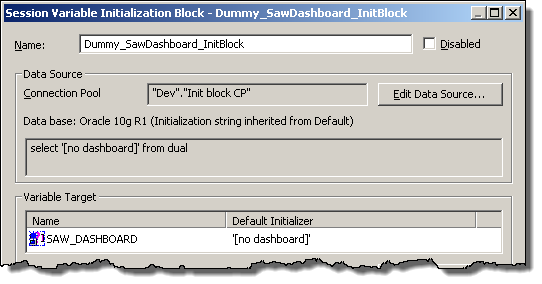
When you’ve finished, you should have two init block/variables pairs set up like this:

Session Variables

Initialisation Blocks

Implementing it – connection pool

Add these three SQL statements to the “Execute before query” of “Connection Scripts” of each Connection Pool which is used for queries.
Do not add them to ones which are used for init blocks / authentication etc.

call dbms_application_info.set_client_info(client_info=>'VALUEOF(NQ_SESSION.DISPLAYNAME)')
call dbms_session.set_identifier('VALUEOF(NQ_SESSION.USER)')
call dbms_application_info.set_module(module_name=>'OBIEE: ' || case when length('VALUEOF(NQ_SESSION.SAW_DASHBOARD)')<40 then 'VALUEOF(NQ_SESSION.SAW_DASHBOARD)' else '...' || substr('VALUEOF(NQ_SESSION.SAW_DASHBOARD)',-37) end,action_name=>case when length('VALUEOF(NQ_SESSION.SAW_SRC_PATH)')<31 then 'VALUEOF(NQ_SESSION.SAW_SRC_PATH)' else '...' || substr('VALUEOF(NQ_SESSION.SAW_SRC_PATH)',-28) end);
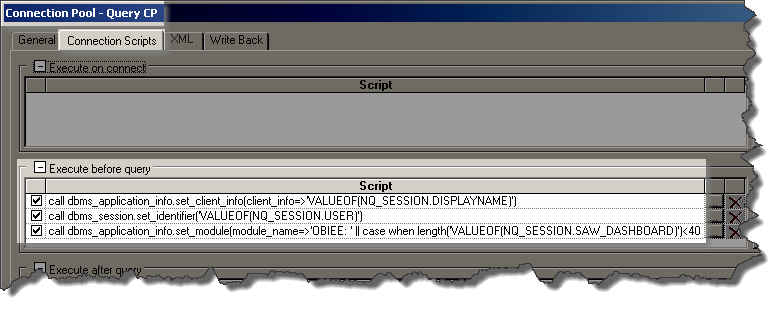
This sets values as follows:

  • Client Identifier is the OBIEE login user id
  • Client Info is the user’s display name.
  • Module and Action are populated with the dashboard name (prefixed by “OBIEE”) and report names respectively, truncated to the left if necessary to fit into the field size.

NB CLIENT_IDENTIFIER and CLIENT_INFO have a larger capacity so could be used if you want to view more of the report/dashboard detail:

V$SESSION column      Max value length
MODULE                47
ACTION                31
CLIENT_INFO           63
CLIENT_IDENTIFIER     63

Reference:
DBMS_APPLICATION_INFO
DBMS_SESSION

Testing the changes

If you’re currently logged into Answers, logout and log back in. This is necessary for the dummy session variables to populate.

Run this sql*plus SQL script below to look at any existing OBIEE queries running on the database.


set linesize 170
col program for a30
col client_info for a20
col client_identifier for a18
col module for a47
col action for a31

SELECT SID,PROGRAM, CLIENT_IDENTIFIER, CLIENT_INFO, MODULE, ACTION FROM V$SESSION WHERE LOWER(PROGRAM) LIKE 'nqsserver%';

Now login to Answers, and run an existing report, or create a new one. When you re-run the SQL script you should see your session now listed:

Not a fan of sql*plus?

If for some strange reason you don’t love sql*plus, you can obviously use the above SQL in any other SQL client. Or, you can fire up Enterprise Manager and see the same set of information:
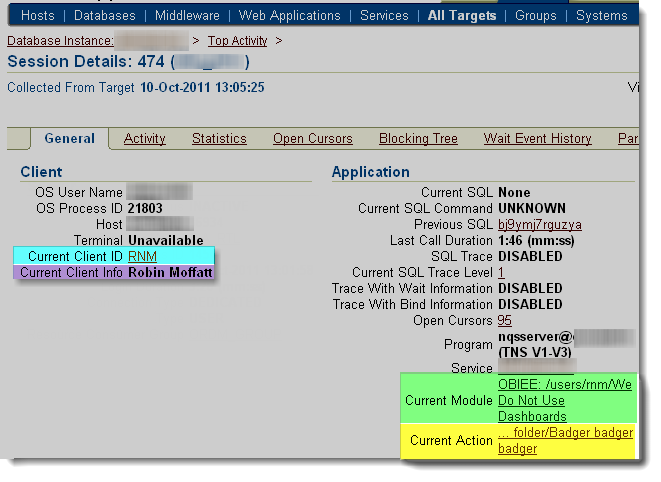
(run at a different time from the SQL above, so different report and dashboard names)

Warning

It’s occurred to me that by parsing in user-provided values to a string that’s executed on the database, there could be the potential for a breach through SQL Injection via a maliciously named report or dashboard.

I’ve not been able to find a report name which does cause trouble, but I have never tried exploiting SQL injection before.

It is another good reason to make sure that you’re using a DB account solely created for reporting queries from OBIEE, because then its privileges can be greatly restricted. This isn’t an excuse not to test for SQL Injection, but a reminder of why good practices such as granting of least privileges exist.

Troubleshooting

  • Make sure you don’tsuffix the database calls with semi-colons (statement terminators). If you do you’ll probably get an error like this:
    [nQSError: 17001] Oracle Error code: 911, message: ORA-00911: invalid character at OCI call OCIStmtExecute
    
  • If you’re having problems implementing this, or doing further playing around with it, you can see the exact SQL that’s executed on connection by bumping up LOGLEVEL and checking NQQuery.log.
  • Don’t use the same connection pool for the init blocks as you do for queries. If you try this, then the init blocks will fire and try to submit a command on the database which requires the variables that the very init blocks are trying to populate. Confused? OBIEE certainly will be too.
  • If someone creates a report or dashboard with single quote in the name, it causes problems. The error will be ambiguous too:

    State: HY000. Code: 10058. [NQODBC

March 8, 2011

OBIEE Systems Management – dodgy counter behaviour

Filed under: bi, bug, jmx, mbeans, obiee, systemsmanagement — rmoff @ 10:59

Over the last few months I’ve been doing a lot of exploring of OBIEE Systems Management data, covered in a mini-series of blog posts, Collecting OBIEE systems management data.

There are a vast number of counters exposed, ranging from the very interesting (Active Sessions, Cache Hits, etc) to the less so (Total Query Piggybacks, although for some seriously hardcore performance tuning even this may be of interest).

This short blog post is about a couple of counters which I’ve been monitoring but which looks to not be entirely reliable. Both are in the Oracle BI DB Connection Pool, and are:

  • Current Connection Count – The current number of open connections in the thread pool.
  • Current Busy Connection Count – The current number of connections assigned to process a query or processing a query in the DB Connection pool.

A picture tells a thousand words in this case:

OBIEE Connection Pool data

We can clearly see :

  • Current Busy Connection Count (“The current number of connections assigned to process a query or processing a query in the DB Connection pool.“) goes negative!
  • Current Connection Count (“The current number of open connections in the thread pool.“) accumulates. Either the counter is buggy, or there really are thousands of open connections in the thread pool which sounds worrying in itself.

These two counters reset and correct themselves only on a BI Server restart, which can be seen by the red vertical lines on the graph.

A snapshot of the current figures (via JConsole) backs up these numbers and puts “Current Connection Count” in context next to the ‘Peak’ and ‘Accumulated’ figures:

OBIEE Systems Management data, viewed through JConsole

December 6, 2010

Collecting OBIEE systems management data with jmx

Filed under: jmx, mbeans, monitoring, obiee, systemsmanagement — rmoff @ 21:30

Introduction

This is the first part of three detailed articles making up a mini-series about OBIEE monitoring. It demonstrates how to capture OBIEE performance information, and optionally graph it out and serve it through an auto-updating webpage.

For some background on OBIEE’s Systems Management component, along with JMX and MBeans, see here and here. The following assumes you know your mbeans from coffee beans and jmx from a bmx.

The metric collection is built around the jmxsh tool. This is similar to jmxterm and both provide command-line access to jmx. Once it’s commandline, it’s scriptable 🙂

This was developed and works on both Windows (through cygwin) and HP-UX.

The Script

jmxsh uses the a scripting language based on tcl, and with a bit of trial-and-error I developed the following script, obieejmx.tcl. It connects to a remote BI server, authenticates to the JMX agent, and then periodically polls the jmx counters and writes the values to a tab-separated file. It runs until you cancel it.

# obieejmx.tcl
# OBIEE JMX collector
# https://rnm1978.wordpress.com
#

# Set connection details
set host my-remote-server
set port 9980
set user jmx-user-name
set pw my-jmx-password

# Define the counters (userdefined ID / MBean / Attribute list, tab separated)
set mbeanattrs [list]
lappend mbeanattrs {1   Oracle BI Management:Oracle BI=Performance,AppName=Oracle BI Presentation Server,name=Oracle BI PS Connection Pool      Current Open Connections}
lappend mbeanattrs {2   Oracle BI Management:Oracle BI=Performance,AppName=Oracle BI Presentation Server,name=Oracle BI PS Query Cache  Current Running Queries}
lappend mbeanattrs {3   Oracle BI Management:Oracle BI=Performance,AppName=Oracle BI Presentation Server,name=Oracle BI PS Query Cache  Current Cache Entries}
lappend mbeanattrs {4   Oracle BI Management:Oracle BI=Performance,AppName=Oracle BI Presentation Server,name=Oracle BI PS Sessions     Active Sessions}
lappend mbeanattrs {5   Oracle BI Management:Oracle BI=Performance,AppName=Oracle BI Presentation Server,name=Oracle BI PS Sessions     Current Sessions}
lappend mbeanattrs {6   Oracle BI Management:Oracle BI=Performance,AppName=Oracle BI Presentation Server,name=Oracle BI PS Sessions     Sessions Logged On}
lappend mbeanattrs {7   Oracle BI Management:Oracle BI=Performance,AppName=Oracle BI Server,type=Oracle BI DB Connection Pool,name=Star_Oracle Data Warehouse_Oracle Data Warehouse Connection Pool     Current Busy Connection Count}
lappend mbeanattrs {8   Oracle BI Management:Oracle BI=Performance,AppName=Oracle BI Server,type=Oracle BI DB Connection Pool,name=Star_Oracle Data Warehouse_Oracle Data Warehouse Connection Pool     Current Connection Count}
lappend mbeanattrs {9   Oracle BI Management:Oracle BI=Performance,AppName=Oracle BI Server,type=Oracle BI Physical DB,name=Oracle Data Warehouse       KiloBytes/sec}
lappend mbeanattrs {10  Oracle BI Management:Oracle BI=Performance,AppName=Oracle BI Server,type=Oracle BI Physical DB,name=Oracle Data Warehouse       Queries/sec}
lappend mbeanattrs {11  Oracle BI Management:Oracle BI=Performance,AppName=Oracle BI Server,type=Oracle BI Physical DB,name=Oracle Data Warehouse       Rows/sec}
lappend mbeanattrs {12  Oracle BI Management:Oracle BI=Performance,AppName=Oracle BI Server,name=Oracle BI General      Active Execute Requests}
lappend mbeanattrs {13  Oracle BI Management:Oracle BI=Performance,AppName=Oracle BI Server,name=Oracle BI General      Active Fetch Requests}
lappend mbeanattrs {14  Oracle BI Management:Oracle BI=Performance,AppName=Oracle BI Server,name=Oracle BI General      Avg. query elapsed time}
lappend mbeanattrs {15  Oracle BI Management:Oracle BI=Performance,AppName=Oracle BI Server,name=Oracle BI General      Queries/sec}
lappend mbeanattrs {16  Oracle BI Management:Oracle BI=Performance,AppName=Oracle BI Server,name=Oracle BI General      Total sessions}
lappend mbeanattrs {17  Oracle BI Management:Oracle BI=Performance,AppName=Oracle BI Server,name=Oracle BI General      Succeeded Logins Ratio as %}

# Write the header
puts -nonewline "Timestamp"
foreach {mbeanattr} $mbeanattrs {
        # Get the mbean & attribute
        set parts [split $mbeanattr "\t"]
        set mbean [lindex $parts 1]
        set attr [lindex $parts 2]
        puts -nonewline "\t$mbean $attr"
}
puts ""

# Connect to the host
jmx_connect -h $host -p $port -U $user -P $pw

# Get the values
while {0 == 0} {
        puts -nonewline "[clock format [clock seconds] -format %Y-%m-%d-%H:%M:%S]"
        foreach {mbeanattr} $mbeanattrs {
                # Get the mbean & attribute
                set parts [split $mbeanattr "\t"]
                set mbean [lindex $parts 1]
                set attr [lindex $parts 2]

                #Uncomment for debug:
                #puts "---"
                #puts "$mbean $attr"

                # Get the metric and write to output
                puts -nonewline "\t[ jmx_get -m $mbean $attr]"

        }
        # Flush the output buffer line
        puts ""
        # Sleep for 60 seconds
        after 60000
}

You may want to tweak the polling frequency, depending on the metrics that you’re collecting and the purpose of them. For building up a general picture of system usage (active sessions, etc), then every minute – or greater – should be sufficient. For other metrics which record rates per second (eg “New Sessions / sec”) then you may well want to sample more frequently.

You invoke this via jmxsh (download link) using the following syntax:

$java -jar jmxsh-R5.jar obieejmx.tcl

or if you’ve setup the (ambiguously-named) file jmxsh, you can use this:

$./jmxsh obieejmx.tcl

It will write the counter values to stdout, so capture it to file using

./jmxsh obieejmx.tcl >> results.jmx 

To run it continually as a background process, use nohup (so it doesn’t die when you logoff) and & (to run it in the background):

# Run collector indefinitely
nohup ./jmxsh obieejmx.tcl >> results.jmx &

The output you’ll get will look like this:

2010-11-29-14:41:17     5       0       38      1       12      9       0       614     0       0       0       0       0       0       0       3       0
2010-11-29-14:42:17     5       0       33      1       12      9       0       614     0       0       0       0       0       0       0       3       0
2010-11-29-14:43:17     5       0       33      1       12      9       0       614     0       0       0       0       0       0       0       3       0
2010-11-29-14:44:17     5       0       33      1       12      9       0       614     0       0       0       0       0       0       0       3       0

To stop the collector running, you’ll need to find the process

$ps -ef|jmxsh 
userid 14695     1  2  Nov 29  ?         5:12 /opt/java6/bin/IA64N/java -jar ./jmxsh-R5.jar obieejmx.tcl

and then kill it

kill 14695

Defining the counters

You’ll have noticed in my script that I define an array of counter names. You can get a list of all the counters in various ways including through Presentation Services (saw.dll?perfmon), OAS/OC4J, or JConsole. My personal preference is using Presentation Services (saw.dll?perfmon) as it gives the list nice and neatly and with an explanation of each counter.
Once you’ve decided which you want to collect, you need to use jmxsh again to get the correct format. Counters are defined as Attributes (eg Current Open Connections) within MBeans (eg Oracle BI Management:Oracle BI=Performance,AppName=Oracle BI Presentation Server,name=Oracle BI PS Connection Pool). Different jmx interfaces seem to label the MBean in a different format, for example:

jmxsh:  Oracle BI Management:Oracle BI=Performance,AppName=Oracle BI Presentation Server,name=Oracle BI PS Sessions
jmxterm:Oracle BI Management:AppName=Oracle BI Presentation Server,Oracle BI=Performance,name=Oracle BI PS Sessions

(spot the order in which “Oracle BI=” and “AppName=” are listed)
So for using jmxsh in your script, use jmxsh to get the exact MBean names otherwise you’ll spend a long time tearing your hair out wondering why it’s not working!
To get jmxsh to list the MBeans, you use it in the ‘browse’ mode. First off, run jmxsh and connect to your OBIEE server using the jmx_connect command


$ java -jar jmxsh-R5.jar
jmxsh v1.0, Tue Jan 22 16:23:12 GMT 2008


Type 'help' for help.  Give the option '-?' to any command
for usage help.


Starting up in shell mode.
% jmx_connect -h myserver -p 9980 -U myjmxuser
Password: ********
Connected to service:jmx:rmi:///jndi/rmi://myserver:9980/jmxrmi.

Hit enter at this point and it’ll switch to browse mode, and list out the MBean Domains.


%
Entering browse mode.
====================================================


 Available Domains:


       1. java.util.logging
       2. JMImplementation
       3. Oracle BI Management
       4. java.lang


  SERVER: service:jmx:rmi:///jndi/rmi://myserver:9980/jmxrmi

Select Oracle BI Management

====================================================
Select a domain: 3
====================================================

This lists all the MBeans within Oracle BI Management – there’s a lot!


 Available MBeans:


       1. Oracle BI Management:Oracle BI=Performance,AppName=Oracle BI Presentation Server,name=Oracle BI PS Chart Engine
       2. Oracle BI Management:Oracle BI=Performance,AppName=Oracle BI Server,type=Oracle BI DB Connection Pool,name=Star_Oracle Data Warehouse_Oracle Data Warehouse Writeback Connection Pool
       3. Oracle BI Management:Oracle BI=Performance,AppName=Oracle BI Presentation Server,type=Oracle BI PS Thread Pools,name=TaskScheduler
       4. Oracle BI Management:Oracle BI=Configuration,type=Presentation Server Configuration,name=Query
       5. Oracle BI Management:Oracle BI=Configuration,type=Presentation Server Configuration,name=AsyncLogon[ThreadPoolDefaults]
       6. Oracle BI Management:Oracle BI=Performance,AppName=Oracle BI Presentation Server,name=Oracle BI PS Query Cache
[...]
     134. Oracle BI Management:Oracle BI=Performance,AppName=Oracle BI Presentation Server,name=Oracle BI PS Sessions
[...]

You can filter by defining a glob filter by typing your search term at the “Select an mbean:” prompt. For example:

====================================================
Select an mbean: Performance
====================================================

 Available MBeans:

       1. Oracle BI Management:Oracle BI=Performance,AppName=Oracle BI Presentation Server,name=Oracle BI PS Chart Engine
       2. Oracle BI Management:Oracle BI=Performance,AppName=Oracle BI Server,type=Oracle BI DB Connection Pool,name=Star_Oracle Data Warehouse_Oracle Data Ware
house Writeback Connection Pool
       3. Oracle BI Management:Oracle BI=Performance,AppName=Oracle BI Presentation Server,type=Oracle BI PS Thread Pools,name=TaskScheduler
       4. Oracle BI Management:Oracle BI=Performance,AppName=Oracle BI Presentation Server,name=Oracle BI PS Query Cache
[...]
      53. Oracle BI Management:Oracle BI=Performance,AppName=Oracle BI Server,type=Oracle BI Generic Cache,name=Star_DrillDownQuery_Cache

  SERVER: service:jmx:rmi:///jndi/rmi://myserver:9980/jmxrmi
  DOMAIN: Oracle BI Management
  GLOB:   *Performance* (space to clear)

This shows just MBeans with Performance in the name. Alternatively use a wildcard within the glob:

Select an mbean: Performance*Cache
====================================================

 Available MBeans:

       1. Oracle BI Management:Oracle BI=Performance,AppName=Oracle BI Presentation Server,name=Oracle BI PS Query Cache
       2. Oracle BI Management:Oracle BI=Performance,AppName=Oracle BI Presentation Server,name=Oracle BI PS Catalog XML Cache
       3. Oracle BI Management:Oracle BI=Performance,AppName=Oracle BI Server,type=Oracle BI Generic Cache,name=Star_DrillDownInfo_Cache
       4. Oracle BI Management:Oracle BI=Performance,AppName=Oracle BI Presentation Server,name=Oracle BI PS Security Manager Account Cache
       5. Oracle BI Management:Oracle BI=Performance,AppName=Oracle BI Server,type=Oracle BI Generic Cache,name=Star_LDAP_Cache
       6. Oracle BI Management:Oracle BI=Performance,AppName=Oracle BI Presentation Server,name=Oracle BI PS Catalog Attribute Cache
       7. Oracle BI Management:Oracle BI=Performance,AppName=Oracle BI Presentation Server,name=Oracle BI PS Security Manager Account Memberships Cache
       8. Oracle BI Management:Oracle BI=Performance,AppName=Oracle BI Server,type=Oracle BI Generic Cache,name=Star_Plan_Cache
       9. Oracle BI Management:Oracle BI=Performance,AppName=Oracle BI Server,type=Oracle BI Generic Cache,name=Star_ColumnAggrInfo_Cache
      10. Oracle BI Management:Oracle BI=Performance,AppName=Oracle BI Server,type=Oracle BI Generic Cache,name=Star_RowWiseInit_Cache
      11. Oracle BI Management:Oracle BI=Performance,AppName=Oracle BI Presentation Server,name=Oracle BI PS DXE Cache
      12. Oracle BI Management:Oracle BI=Performance,AppName=Oracle BI Presentation Server,name=Oracle BI PS Cube Cache
      13. Oracle BI Management:Oracle BI=Performance,AppName=Oracle BI Server,name=Oracle BI Data Cache
      14. Oracle BI Management:Oracle BI=Performance,AppName=Oracle BI Presentation Server,name=Oracle BI PS XML Document Caches
      15. Oracle BI Management:Oracle BI=Performance,AppName=Oracle BI Server,type=Oracle BI Generic Cache,name=Star_DrillDownQuery_Cache

  SERVER: service:jmx:rmi:///jndi/rmi://myserver:9980/jmxrmi
  DOMAIN: Oracle BI Management
  GLOB:   *Performance.*Cache* (space to clear)

If you use globs, remember to clear them by typing space and then enter, otherwise when you list Attributes you won’t see any which don’t also match your filter.

To view the Attributes for an MBean, enter the MBean’s number:

====================================================
Select an mbean: 134
====================================================

 Attribute List:

       1. -r- Integer     Current Sessions
       2. -r- Integer     Maximum Sessions
       3. -r- Integer     Sessions Logged On
       4. -r- Integer     Maximum Logged On
       5. -r- Integer     Current Embryonic Sessions
       6. -r- Integer     Maximum Embryonic Sessions
       7. -r- Integer     Active Sessions
       8. -r- Integer     Maximum Active Sessions
       9. -r- Integer     Total Lifetime Sessions
      10. -r- Integer     New Sessions / sec
      11. -r- Integer     Total Failed Logons
      12. -r- Integer     Failed Logons/sec
      13. -r- Integer     Total Logons
      14. -r- Integer     New Logons/Sec


  SERVER: service:jmx:rmi:///jndi/rmi://myserver:9980/jmxrmi
  DOMAIN: Oracle BI Management
  MBEAN:  Oracle BI Management:Oracle BI=Performance,AppName=Oracle BI Presentation Server,name=Oracle BI PS Sessions

Once you’ve chosen your MBeans and Attributes, you can incorporate them into the obieejmx.tcl script by adding additional lappend lines. The format is:

lappend mbeanattrs {<ID><tab><mbean><tab><attribute>}

ID is just a number used later on in the process, it can be whatever you like. Make sure the three values are tab-separated.
An example line is:

lappend mbeanattrs {17  Oracle BI Management:Oracle BI=Performance,AppName=Oracle BI Presentation Server,name=Oracle BI PS Sessions      Current Embryonic Sessions}

If you get the error “Cannot convert result to a string” then check your MBean and Attribute names, normally this error means it can’t find what you’ve asked for. Also check that the array member definitions (lappend) are tab separated, not just space separated.

Where next?

Now you’ve got the data, do something with it! See charting OBIEE performance data with gnuplot.

OBIEE monitoring

Filed under: hack, jmx, mbeans, monitoring, obiee, systemsmanagement — rmoff @ 21:29

Those of you who read my blog regularly may have noticed I have a slight obsession with the OBIEE systems management capability which is exposed through JMX. Venkat has blogged this week about JMX in OBI11g, and it’s clearly a technology worth understanding properly.
I’ve recently been tinkering with how to make use of it for monitoring purposes, most recently using JConsole and discussed here. What follows is an extension of this idea, cobbled together with a bit of shell scripting, awk, gnuplot, and sticky backed plastic. It’s built on OBIEE 10g – for OBI11g it may differ (although I understand that Performance MBeans still exist).

Whether you collect metrics for day-to-day monitoring of OBIEE, capacity planning, or investigative work, it’s valuable data (in my humble opinion) that will help you understand the usage of the application by the users that you support.

To whet your appetite, here’s a sample of what you can produce, in realtime:

Performance metrics from a two-server OBIEE cluster

Performance data related to Sessions in BI and Presentation Services

Before you start this, I recommend reading how to secure your jmx agent if you’re working with production systems.

Overview

There are three parts to my monitoring application, and you can pretty much pick and mix as you want. Obviously without any data collected then graphing it will be pretty dull, but you may opt to collect the data and then work with it another way (Excel, OBIEE, etc).
I’ve broken the details down into three separate blog posts:

  1. Metric collection from a remote BI Server, using jmxsh
  2. Graph rendering of the collected data, using gnuplot
  3. Web page serving of the rendered graphs, bolted onto the OAS already in place for Presentation Services.

November 4, 2010

A Poor Man’s OBIEE EM/BI Management Pack

Filed under: jmx, monitoring, obiee, systemsmanagement — rmoff @ 15:32

Folk from Yorkshire are tight, so the stereotype goes. So here’s a cheap-ass way to monitor OBIEE 10g using nothing but the OBIEE built-in systemsmanagement component, the jmx agent, and jconsole (which is part of the standard Java distribution):

From here you can also export to CSV the various counters, and then store history, plot it out with gnuplot or Excel, etc.

If anyone’s interested let me know and I’ll document a bit more about how I did this, but it’s basically building on previous work I’ve documented around jmx and OBIEE.

March 5, 2010

Securing OBIEE Systems Management JMX for remote access

Filed under: jmx, obiee, security, systemsmanagement — rmoff @ 17:21

JMX

OBIEE’s Systems Management functionality exposes performance counters and the application’s configuration options through Java MBeans and optionally a protocol called JMX.

It’s extremely useful, and is documented pretty widely :

In this article I’m going to discuss the use of JMX to access these counters remotely, and a possible security issue that’s present in the BI Management Pack manual. The BI Management Pack is an add-on to Oracle’s Enterprise Manager / Grid Control for managing OBIEE, see Mark Rittman’s excellent guide on Oracle’s website.

Security Issue

To access Systems Management data remotely you need to start the JMX agent, having configured it for remote access first. However, if you are lazy, and/or follow the configuration in the BI Management Pack manual, and set com.sun.management.jmxremote.authenticate=false anyone can update your OBIEE configuration if they have network access to your server and a client for JMX (such as jconsole, part of standard java distribution) and time to guess the port number. This is not cool. Ever played with AUTHENTICATION=BYPASS_NQS?

The latest Java documentation (now with an Oracle logo!) does address this:

Caution – This configuration is insecure. Any remote user who knows (or guesses) your JMX port number and host name will be able to monitor and control your Java application and platform. While it may be acceptable for development, it is not recommended for production systems.

To be clear – if you’re not running the JMX Agent, this is all irrelevant. It’s only if you’re running it and haven’t thought through the consequences of the configuration.

Making the JMX Agent more secure

One way to secure the JMX agent is to use password authentication. The other is to set up SSL. The following demonstrates how to enable password authentication.

Please note – the following covers how to password-protect the JMX agent. It isn’t making it bullet-proof, and there’s no reason why a dictionary attack against it wouldn’t work as there’s no lockout. This also means it’s a good reason not to use a default username from the config files. Note also the following warning in the Java documentation: (if anyone can translate it into english I’d be grateful 😉 )

“WARNING: A potential security issue has been identified with password authentication for JMX remote connectors when the client obtains the remote connector from an insecure RMI registry (the default). If an attacker starts a bogus RMI registry on the target server before the legitmate one is started, then the attacker can steal clients’ passwords.”

To enable password authentication you need to edit three files.
The first file to edit is the agent script, runagent.sh. You’ll find this in $ORACLEBI_HOME/systemsmanagement.
By default, the file looks like this:

#!/bin/sh
# this is a template of runagent.sh to be used on Unix.
# The installer will fill in JAVA_HOME, SAROOTDIR, and SATEMPDIR

export JAVA_HOME=/usr/java/jdk1.6.0_17
export SAROOTDIR=/app/oracle/product/obiee
export SADATADIR=/data
export SATEMPDIR=/data/tmp
export UNIXPERFDIR=${SATEMPDIR}

java_cmd="${JAVA_HOME}/bin/java -Djava.library.path=${SAROOTDIR}/server/Bin -Dcom.sun.management.jmxremote -classpath analytics-jmx.jar:lib/xmlparserv2.jar oracle.bi.analytics.management.StandardConsoleAgent"

${java_cmd}

To enable remote access to the JMX agent you change the java_cmd to the following:

java_cmd="${JAVA_HOME}/bin/java -Djava.library.path=${SAROOTDIR}/server/Bin -Dcom.sun.management.jmxremote -Dcom.sun.man
agement.jmxremote.port=9980 -Dcom.sun.management.jmxremote.authenticate=false -Dcom.sun.management.jmxremote.ssl=false -
classpath analytics-jmx.jar:lib/xmlparserv2.jar oracle.bi.analytics.management.StandardConsoleAgent"

Note that jmxremote.authenticate is set to false. To secure the JMX agent you change it to true:

java_cmd="${JAVA_HOME}/bin/java -Djava.library.path=${SAROOTDIR}/server/Bin -Dcom.sun.management.jmxremote -Dcom.sun.management.jmxremote.port=9980 -Dcom.sun.management.jmxremote.authenticate=true -classpath analytics-jmx.jar:lib/xmlparserv2.jar oracle.bi.analytics.management.StandardConsoleAgent"

Now note what JAVA_HOME is set to in the runagent.sh file (in the above example it’s /usr/java/jdk1.6.0_17). Navigate to this directory, and then to jre/lib/management. You should see these four files:

jmxremote.access
jmxremote.password.template
management.properties
snmp.acl.template

Create a copy of jmxremote.password.template to a file called jmxremote.password. Open the file and you’ll see two default users (or “roles”) as the documentation calls them.

$cp jmxremote.password.template jmxremote.password
$vi jmxremote.password
#
# Following are two commented-out entries.  The "measureRole" role has
# password "QED".  The "controlRole" role has password "R&D".
#
# monitorRole  QED
# controlRole   R&D

We’ll come back to this file in a moment. Now open jmxremote.access and you’ll see the access rights for the users (“roles”) in the password file are defined here:

#       "readonly" grants access to read attributes of MBeans.
#                   For monitoring, this means that a remote client in this
#                   role can read measurements but cannot perform any action
#                   that changes the environment of the running program.
#       "readwrite" grants access to read and write attributes of MBeans,
#                   to invoke operations on them, and to create or remove them.
#                   This access should be granted to only trusted clients,
#                   since they can potentially interfere with the smooth
#                   operation of a running program

So, now decide how you want to regulate access. I would strongly recommend that the only access available through remote JMX is readonly. Read/Write access to configuration needs to be through one auditable route, and I’d suggest this isn’t the best one. If that’s how we’re going to configure it, we set the files up like this:
(delete or comment out everything in the files first, having taken a backup first)
jmxremote.password:

jmxobiee  S3cur3Passw0rd

jmxremote.access

jmxobiee readonly

Finally, secure access to the password file so that it’s only readable by the application owner ID:

chmod 600 jmxremote.password

Now, go back to $ORACLEBI_HOME/systemsmanagement, and start the JMX agent:

nohup ./runagent &

(the nohup and & make it run in the background so it doesn’t quit when you exit your session)

Having started your agent, you can go to JConsole and login to it remotely.

See the document here for the full details of securing JMX, including use of SSL and alternative password file locations.

Using JConsole

JConsole should be in your PATH, so enter JConsole from Start -> Run (Windows), or alternatively find it in the bin directory of your JAVA home directory (Windows/Linux/Unix).

To see the OBIEE counters click on MBeans tab :

and then expand the “Oracle BI Management” folder:

You’ll notice if you’re connected as a readonly user and try to change any values you get an error:

When OBIEE is running you get some very detailed performance counters:

(If you only see Configuration folders within BI then it’s because OBIEE isn’t running 🙂 )

One nice thing you can do is see a graph of the metrics, by clicking on Attributes in the left tree, and then double-clicking on the number you want to graph in the right pane:

Footnote

I find the possibilities of the JMX interface to BI counters very interesting, and am surprised there is so little discussed about it. Maybe everyone else is merrily using it and feels no need to brag 😉

The counters in particular that BI Server exposes gives a peek under the covers of an application that has no detailing logging other than NQQuery.log. Using these counters through JMX we can look at things such as the current state of a connection pool, or the BI Server Cache.

Does anyone know of a freeware tool for collecting data from JMX? I know I could use the BI Management Pack but we don’t have it. JConsole or JManage give visualisation of the data realtime, but the latter is very rough around the edges.

October 6, 2009

Usage Tracking – only half the story …

Filed under: obiee, systemsmanagement, usagetracking — rmoff @ 10:28

OBIEE comes with a very useful usage tracking feature. For information about it and how to set it up see these links:

Usage Tracking captures the logical SQL of queries in a column called QUERY_TEXT in the table S_NQ_ACCT. However, out of the box this column is defined as 1k (1024 bytes) long. In some situations this will limit its usefulness because the text will be truncated if necessary when it’s inserted.

When it’s truncated you may see this message in NQServer.log:

     [59048] Usage Tracking encountered an insert statement execution error.  This error has occurred 1 times and resulted in the loss of 1 insert statements
 since this message was last logged.
     [nQSError: 17001] Oracle Error code: 12899, message: ORA-12899: value too large for column "OBIEE_USAGE_TRACKING"."S_NQ_ACCT"."QUERY_TEXT" (actual: 1039, maximum: 1024

To increase the length of query captured to an Oracle DB do the following:

Stop nqsserver

Unix: run-sa.sh stop
Windows: Services -> Stop Oracle BI Server

ALTER table to increase column length

alter table s_nq_acct modify query_text varchar2(4000);

4000 is the maximum for a varchar2. You could define it as less if you wanted. 1024 is the default out of the OBIEE box.

Amend RPD physical layer

Manually – Admin Tool

Load the RPD in the Administration Tool, and edit the properties of the QUERY_TEXT column in the S_NQ_ACCT table.
1
2

Automatically – UDML

NB this is NOT SUPPORTED by Oracle!!

Copy this into a text file:

DECLARE COLUMN "Oracle Analytics Usage"."Catalog"."dbo"."S_NQ_ACCT"."QUERY_TEXT" AS "QUERY_TEXT" TYPE "VARCHAR" PRECISION 4000 SCALE 0  NULLABLE PRIVILEGES ( READ);

Apply it to the RPD using nqUDMLExec. I’ve split the statement over multiple lines to make it more readable.

c:\OracleBI\server\Bin\nQUDMLExec.exe
-U Administrator
-P SADMIN
-I c:\extend_query_text.udml
-B c:\OrignalRPD.rpd
-O c:\UpdatedRPD.rpd

For more information on using UDML see here and here.

Start nqsserver

Unix: run-sa.sh start or run-sa.sh start64
Windows: Services -> Start Oracle BI Server

July 29, 2009

OBIEE performance monitoring and alerting with jManage

Filed under: jManage, jmx, monitoring, obiee, performance, systemsmanagement — rmoff @ 10:47

OBIEE’s Systems Management component exposes configuration and performance data through Java MBeans. As discussed in other posts these can be be accessed through several different ways:

Since it’s a standard java technology being used we can in theory use anything that is designed for monitoring mbeans via jmx. Doing some Googling I discovered jManage.

jmanage13

JManage (homepage / SourceForge project page) describes itself thus:

jManage 2.0 is an open source application management platform, which provides a centralized console for managing application clusters and distributed-application environments

The latest version is a Release Candidate (RC) from 2007, and whilst the website’s forum isn’t entirely a ghost town it’s evidently not in active development.

Installing JManage on Windows

(This is a bare-bones installaion and what I did to get something up and running – it is probably not how it should be done)

  1. Download from SourceForge
  2. Unzip the downloaded archive somewhere
  3. From the command line run bin/startup.cmd
  4. Enter the default password 123456 when prompted
  5. Assuming you don’t get any errors go to http://localhost:9090/ where you should get a login page.
  6. Login at admin / 123456
  7. You should get a list of Managed Applications with one entry, jManage

    Default jManage homepage

    Default jManage homepage

Adding OBIEE to jManage

NB: If you have separate BI and PS servers you’ll need to monitor both, as the performance data is local

  1. This assumes that you installed Systems Management when you installed OBIEE. If in doubt have a look for [OracleBI home]/systemsmanagement
  2. In [OracleBI home]/systemsmanagement edit the runagent.cmd (or .sh if it’s a unix installation) to make the data accessible remotely as follows:

    On the java_cmd line replace
    -Dcom.sun.management.jmxremote
    with
    -Dcom.sun.management.jmxremote -Dcom.sun.management.jmxremote.port=9980 -Dcom.sun.management.jmxremote.authenticate=false -Dcom.sun.management.jmxremote.ssl=false

    (See here for more information on configuring jmx)

  3. Start the agent by running runagent.cmd (or .sh if it’s a unix installation). You should get this kind of output:
    [...]
    ========================================
    Analytics JMX Agent
    ========================================
    Started...
    29-Jul-2009 09:01:32 oracle.bi.analytics.management.monitoring.AppPerfMon refresh
    INFO: Oracle BI Presentation Server has started. Perfcounter data is collected.
    29-Jul-2009 09:01:32 oracle.bi.analytics.management.monitoring.AppPerfMon refresh
    INFO: Oracle BI Server has started. Perfcounter data is collected.
  4. If you want to be sure it’s working, use jconsole to connect and examine the MBeans exposed. See here for more information
  5. In jManage click on Add Application (if you can’t see this make sure you’re on the http://localhost:9090/config/managedApplications.do page)
  6. Choose JSR160 as Application Type
  7. Enter a description name for your server, and then for the URL this:

    service:jmx:rmi:///jndi/rmi://YourServer:9980/jmxrmi

    (nb 9980 is the port specified in the runagent.cmd script, so change this if need be)

  8. Leave Username, Password, java.naming.factory.initial and java.naming.provider.url as they default to on the formjmanage02
  9. Click Save
  10. If it’s worked then you should be back at the Managed Applications page with your server listed and hopefully a green icon next to it, indicating that jManage has successfully connectedjmanage03

NB: There seems to be a bug in adding an application to jManage which might catch you out. If you copy and paste the service URL you get a space appended to the end, which means your application gets added but jManage can’t connect to it (so lists it as down / red icon). If you examine the console you’ll see this:

29-Jul-2009 11:07:27 org.jmanage.core.management.ServerConnector getServerConnection
INFO: Failed to connect. error=Failed to retrieve RMIServer stub: javax.naming.NameNotFoun
dException: jmxrmi

If you edit the application to remove the trailing space from the URL you’ll see in the console that it doesn’t retry the URL, so I’m guessing doesn’t register the removal of the space.
The workaround is to delete the application and re-add it, being careful not to include the trailing space.

Exploring jManage & OBIEE

Current performance numbers

From the application page, enter click on Find Managed Objects (leaving the filter as *:*). You’ll get a list of MBeans which will be familiar if you’ve already explored MBeans through jconsole or oc4j.

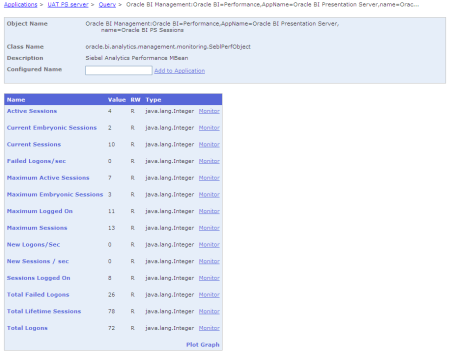
Click on like Oracle BI=Performance,AppName=Oracle BI Presentation Server,name=Oracle BI PS Sessions and you’ll get a list of the current values of session metrics within Presentation Services

jmanage05

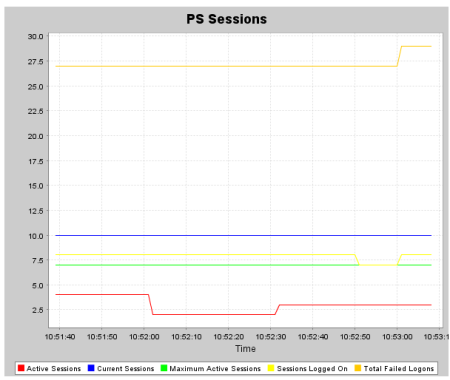
Graphing performance

Now click on Plot Graph (bottom right corner of the metrics list box) and tick a handful of metrics to graph. Click on Next. Enter a name for the graph and a polling interval, and click on Save.

You’ll get taken back to the main application page, where you should now have Graphs box, with your newly created graph listed underneath. Click on the graph name.

jmanage07

You’ll get a java applet firing up for the graphing. The graph applet has a context menu (right click) through which you can customise its appearance.

jmanage08

You can graph across metric groups (eg. Sessions and Cache) by selecting Add Graph from the main application page.

See here for jManage graph reference

NB: You might get a blank graph (with no legend for the metrics you selected). If this is the case then go back to the command window where you started jManage from and you’ll probably see an error:

29-Jul-2009 10:41:38 org.mortbay.jetty.servlet.ServletHandler handle
WARNING: Error for /app/fetchAttributeValues.do;jsessionid=2an2geo5rpuib
java.lang.AssertionError
        at org.jmanage.webui.actions.app.MBeanAttributeValuesAction.execute(MBeanAttribute
ValuesAction.java:76)

This highlights that jManage is not a finished product (nor does it claim to be), so bear this in mind when considering investing time in it.
It looks like in this instance the New Logons/Sec object was causing the failure, and it’s the only one with a value of zero so maybe that caused the error?? But another object, Completed Requests/sec, has a value of zero but graphs successfully.
Looking at the output of runagent.cmd shows:

java.lang.NullPointerException
        at oracle.bi.analytics.management.monitoring.SeblPerfObject.getAttribute(SeblPerfObject.java:371)
        at oracle.bi.analytics.management.monitoring.SeblPerfObject.getAttributes(SeblPerfObject.java:510)
        at oracle.bi.analytics.management.monitoring.SeblPerfObjectInstanceMBean.getAttributes(SeblPerfObjectInstanceMBean.java:148)
        at com.sun.jmx.mbeanserver.DynamicMetaDataImpl.getAttributes(DynamicMetaDataImpl.java:125)
        at com.sun.jmx.mbeanserver.MetaDataImpl.getAttributes(MetaDataImpl.java:189)
        at com.sun.jmx.interceptor.DefaultMBeanServerInterceptor.getAttributes(DefaultMBeanServerInterceptor.java:696)
        at com.sun.jmx.mbeanserver.JmxMBeanServer.getAttributes(JmxMBeanServer.java:686)
        at javax.management.remote.rmi.RMIConnectionImpl.doOperation(RMIConnectionImpl.java:1389)
[...]

So to be fair to jManage it could be that OBIEE’s systems management isn’t honouring the exposed metric, but it would be nice if jManage ignored it and still showed the others, or flagged up the error.

Managed Objects

I think Managed Objects are a way of “bookmarking” specific MBeans for faster access from the dashboard for querying current values and defining graphs or alerts.
For example, the object detailing performance data about our data warehouse connection pool, Oracle BI=Performance,AppName=Oracle BI Server,type=Oracle BI DB Connection Pool,name=Star_Oracle Data Warehouse_Oracle Data Warehouse Connection Pool, is going to be of more interest than all the Configuration objects, plus a bunch of performance objects that we probably won’t examine too closely that often.
From the application page, click on Add Managed Object. Enter a display name next to the object(s) you’re interested in, and click on Add (at the bottom of the page).
jManage Management Console_1248864159305
Your new object is displayed on the application home page:
jmanage15
from where you can click through to see the current metric values, and define a graph or alerts.

Alerting

You can define alerts which will fire to email and/or the jManage home page:
jmanage09
To do this click on Add Alert from the application page, or Monitor when browsing the Management Objects
jmanage10

jmanage11

To use email alerts you need to update the Email properties section of jmanage.properties in the bin folder of jManage.

Application Clustering

Application Clustering is useful for defining groups of applications. They don’t have to actually be clustered. To set it up click on Add Application Cluster from http://localhost:9090/config/managedApplications.do

jmanage14
The status of an application filters up, so for example if the BI server is marked as down then the parent application cluster is also marked as down.

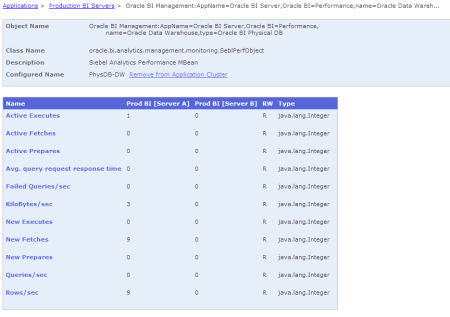
This Clustering feature is very useful for being able to see side-by-side metrics from multiple OBIEE nodes:
jmanage16

If graphing could be done at a cluster level that’d be even better 🙂 (per this feature request)

Configuration

As well as performance data, OBIEE Systems Management mbeans expose all the configuration options. You can edit this through jManage (just as you can through jconsole or oc4j), but bare in mine that no backups are taken of the config files so you should be cautious when using this.

Further info

jManage documentation: http://www.jmanage.org/wiki/index.php/Documentation
Errors are logged to the console and also logs/error.log in the jManage folder.

Further thoughts

The documentation details Dashboard development so it might be possible to build up a half-decent dashboard for assessing the overall OBIEE performance & status at a high level.

Threshold alerts on OBIEE mbeans could be logged and picked up by an enterprise systems management tool (although hopefully that tool could interface with jmx and the mbeans directly?)

The command line mode could be a way of extracting performance mbean values, although would a direct native java application be more appropriate for anything other than experimentation?

The graphing functionality in jManage – which would be one of the main reasons for using this instead of oc4j or jconsole for looking at the point-in-time numbers – is immature with frustrations like not being able add or remove metrics from an existing graph.

Bottom line

Whilst an unfinished product, jManage gives an interesting option to extending OBIEE performance monitoring and alerting. However, the BI Management Pack for Enterprise Manager is obviously the proper way to monitor OBIEE at the Enterprise level, and there’d have to be a really good reason to use jManage for monitoring OBIEE in anything other than an exploratory manner.

Create a free website or blog at WordPress.com.