rmoff

December 3, 2010

OBIEE 10g – javahost hang

Filed under: javahost, obiee, sawserver — rmoff @ 14:06

Hot on the heels of one problem, another has just reared its head.

Users started reporting an error with reports that included charts:

Chart server does not appear to be responding in a timely fashion. It may be under heavy load or unavailable.

Set up is a OBIEE 10.1.3.4.1 two-server deployment with BI/PS/Javahost clustered and loadbalanced throughout.

Diagnostics

Javahost was running, and listening, on both servers:

$ps -ef|grep javahost
obieeadm 14076     1  0  Nov 25  ?         9:23 /app/oracle/product/OracleAS_1/jdk/bin/IA64N/java -server -classpath /app/oracle/product/obiee/web/javahost/lib/core/sautils.ja
$netstat -a|grep 9810|grep LISTEN
tcp        0      0  *.9810                 *.*                     LISTEN

In Javahost log file on both servers there were these errors reported, but since javahost had started over a week ago:

Nov 30, 2010 8:08:36 AM MessageProcessorImpl processMessage
WARNING: Unexpected exception. Connection will be closed
java.io.EOFException
        at com.siebel.analytics.web.sawconnect.sawprotocol.SAWProtocol.readInt(SAWProtocol.java:167)
        at com.siebel.analytics.javahost.MessageProcessorImpl.processMessage(MessageProcessorImpl.java:133)
        at com.siebel.analytics.javahost.Listener$Job.run(Listener.java:223)
        at com.siebel.analytics.javahost.standalone.SAJobManagerImpl.threadMain(SAJobManagerImpl.java:205)
        at com.siebel.analytics.javahost.standalone.SAJobManagerImpl$1.run(SAJobManagerImpl.java:153)
        at java.lang.Thread.run(Thread.java:595)

Charts are written to a temp folder, but none have been written since yesterday afternoon:

$ls -lrt /data/bi/tmp/sawcharts/ |tail -n 2
-rw-r-----   1 obieeadm   biadmin      13611 Dec  2 16:30 saw4cee1a27-7.tmp
-rw-r-----   1 obieeadm   biadmin          0 Dec  2 16:31 saw4cee1a27-32.tmp

$ls -lrt /data/bi/tmp/sawcharts/ |tail -n 2
-rw-r-----   1 obieeadm   biadmin       7454 Dec  2 15:25 saw4cee219b-1.tmp
-rw-r-----   1 obieeadm   biadmin          0 Dec  2 15:28 saw4cee219b-6.tmp

First time the error was seen: (from sawserver.out.log)

server01: Fri Dec  3 09:40:23 2010
server02: Thu Dec  2 15:44:38 2010

Resolution

It looked like javahost was up, but not responding to requests — which is pretty much what the error message said on the tin. The solution was that of many a computer problem – turn it off and turn it back on again.

Since the rest of the (production!) OBIEE service was up and in use, I didn’t want to use the normal shutdown script run-saw.sh as this would also kill Presentation Services. Therefore I extracted the following from run-saw.sh and ran it manually on server01:

set +u
ANA_INSTALL_DIR=/app/oracle/product/obiee
. ${ANA_INSTALL_DIR}/setup/common.sh
./shutdown.sh -service

This successfully killed javahost. I restarted it using :

nohup ./run.sh -service >> /data/bi/web/log/javahost.out.log 2>&1 &

But – the error remained when I refreshed the reports (on both servers).

I then killed javahost on server02 using the same method. At this point, Charts started working again. Presumably Presentation Services had been using javahost on server02 and not recognising it had hung saw no reason to switch to javahost on server01. Once it was killed on server02 it switched and thus started working again.
To complete the work I restarted javahost on server02.

Investigation

The only hit on MOS and Google I found was this: OBIEE Chart Server Error When Showing Charts (Doc ID 944139.1) which details some parameters to tweak, although more to do with javahost being busy (which it wasn’t in this case).

June 14, 2010

Measuring real user response times for OBIEE

Filed under: obiee, performance, sawserver — rmoff @ 12:54

@alexgorbachev tweeted me recently after picking up my presentation on Performance Testing and OBIEE.

His question got me thinking, and as ever the answer “It Depends” is appropriate here 🙂

Why is the measurement being done?

Without knowing the context of the work Alex is doing, how to measure depends on whether the measurement needs to be of: –

  1. The actual response times that the users are getting, or
  2. The response times that the system is currently capable of delivering

This may sound like splitting hairs or beard-scratching irrelevance, but it’s not. If the aim of the exercise is to be able to make a statement along the lines of:

On Monday morning between 09:00 and 10:00 we saw system response times of x seconds

then we can consider simulating a user and recording response times this way. After all, what difference does it make whether it’s Jim, Jemima or Jeremy using the system, or a simulated web client? They’re all sending an HTTP request to the same web server, hitting the same presentation services, BI server, and database.
If on the other hand we want to say something like:

On Monday morning between 09:00 and 10:00 response times experienced by the end user were x seconds

then we need to audit and trace user activity through some means. We can’t use a simulated user session, because it would only ever be that – simulated. If a user says that the system performance is awful then you need to be able to quantify and diagnose that, and the best way is through their eyes. A simulated user is only ever going to be a best-guess of user activity, or even if it’s a replay of past behaviour it may not be the same as they’re doing currently.

These considerations also feed into the point at which we take the measurements. There is no out of the box tracking of response times at the end-user, but there is out of the box tracking of response times at the BI Server. If you are happy to settle for the latter then you save yourself a lot of work. If your requirement is to give an extremely accurate figure for the response time at the end-user then Usage Tracking data from the BI Server is irrelevant (because it doesn’t account for time spent in Presentation Services). However, if you know anecdotally that your reports aren’t that complex and generally time in Presentation Services is minimal then you should consider Usage Tracking, unless the precision required for response time is so great. Consider which is better – to spend an hour configuring Usage Tracking and get response times accurate to within a few seconds (assuming that Presentation Services time is either minimal or consistent so can be factored in), or spend x days or weeks trying to hack together a way or measuring times at the end user — is the extra accuracy definitely necessary?
See slides 11-13 of my presentation for more discussion around this and defining the scope of a test and measurement taking.

So, these thoughts aside, what are the options for examining response times at the end-user point of OBIEE?

Actual response times as experienced by users

As discussed above, Usage Tracking data will get you the response times at the BI server, but doesn’t include anything upstream of that (Presentation Services, App/Web server, network, client rendering).
The options that I can think of for recording timings at the end user are:

  1. Presentation Services Session Monitor – This is a point-in-time record in Presentation Services of each request that is served. It logs the Logical SQL, request type and source, user, records returned, and response time. For a single dashboard there may be many entries. It’s entirely transient so far as I know, so is only useful for observing a session as it happens. It would be nice if there were a web services interface to this but it doesn’t look like there is. You can access it directly at http://%5Bserver%5D:%5Bport%5D/analytics/saw.dll?Sessions
  2. Log mining – sawserver – The presentation services log file, sawserver.log, can be configured to record detail down to a very low level, certainly enough to be able to track user requests and responses. However unless you’re looking at diagnosing a problem for a specific user then this method is probably unrealistic because such levels of logging on a production server would be unwise.
  3. Client side logging – some kind of hack to monitor and record the user’s experience. Something like FireBug or Fiddler2 in logging mode? Not very viable unless it’s low number of users and you have access to their web browser & machine.

Bear in mind that options 1 and 2 only give the response time as far as Presentation Services; they do not include network and rendering at the client. In some cases these times can be considerable (particularly if you have badly designed reports).

Response times of the system

If you’re just trying to measure response times of requests sent to Presentation Services there are several possibilities. As above it depends on the aim of your testing as to which approach you choose:

  1. Simulate user client activity – Use a web client testing tool (eg. Load runner, OATS, Selenium) to record and replay user actions in Answers/Dashboards as if through a web browser, and capture the timings. NB just because Load Runner is best known for Load testing, there’s no reason it can’t be used for replaying individual users to measure standard response times rather than under load. I think (although haven’t tried) HP’s BAC can also replay LoadRunner VUser scripts and capture & monitor timings over time, alerting for deviances.
  2. Go URL – Documented in Chapter 11 of the Presentation Services Admin Guide (and Nico has a nice summary and set of examples here), this is a way of issuing direct requests to Presentation Services by building up the request in the URL. Using this method you could then wrap a simple wget / curl script around it and build up a set of timings that way.
    curl -o c:\scratch\tmp.html "http://[server]:[port]/analytics/saw.dll?Dashboard&PortalPath=%2Fshared%2FFinancials%2F_portal%2FPayables&Page=Overview&NQUser=User&NQPassword=Password"

    Bear in mind that Answers/Dashboards are asynchronous so the first server response may not equate to a fully-loaded dashboard (you may get “Searching … ” first, and then the chart/table is delivered & rendered). See some of the discussion on my earlier postings around Load Runner, particularly this one.

  3. Web services – documented here, this would be similar to Go URL, in that it’s a way of requesting content from Presentation Services in a way that can be scripted and thus timed – but again is not necessarily reproducing the full user experience so make sure you’re aware of what you are and are not actually testing.
  4. Can anyone suggest other options?

March 5, 2010

Who’s been at the cookie jar? EBS-BI authentication and Load Balancers

Filed under: cluster, load balancing, obiee, sawserver, support — rmoff @ 10:44

We hit a very interesting problem in our Production environment recently. We’d made no changes for a long time to the configuration, but all of a sudden users were on the phone complaining. They could login to BI from EBS but after logging in the next link they clicked took them to the OBIEE “You are not logged in” screen.

Our users login to EBS R12 and then using EBS authentication log in to OBIEE (10.1.3.4). Our OBIEE is deployed on OAS, load balanced across two servers by an F5 BIG-IP hardware load balancer.

In the OBIEE NQServer.log we started to see a lot of these errors around the time users started complaining:

[nQSError: 13011] Query for Initialization Block 'EBS Security Context' has failed.
[nQSError: 23006] The session variable, NQ_SESSION.ACF, has no value definition.

The EBS/BI authentication configuration was not done by me, and the theory of it was one of the things on my to-do list to understand but as is the way had never quite got around to it. Here was a good reason to learn very quickly! This posting by Gerard Braat is fantastic and brought me up to speed quickly. There’s also a doc on My Oracle Support, 552735.1, and some more info from Gareth Roberts on the OTN forum here.

We stopped Presentation Services on one of the servers, and suddenly users could use the system again. If we reversed the stopped/started servers, users could use the system. With one Presentation Services server running, the system was fine. With both up, users got “You are not logged in”. What did this demonstrate? That on their own, there was nothing wrong with our Presentation Services instances.

We soon suspected the load balancer. The load balancer sets a cookie on each user’s web browser at the initial connection as they connect to BI. The cookie is used in each subsequent connection to define which application server the user should be routed to. This is because Presentation Services cannot maintain state across instances and so the user must always come through to the same application server that they initially connected to (and therefore authenticated on).

What had happened was that the Load Balancer was issuing cookies with an expiry date already in the past (the clock was set incorrectly on it *facepalm*). This meant that the initial connection from EBS to BI was successful, because authentication was done as expected. But – the next time the client came back to the BI server for a new or updated report, they hit the Load Balancer and since the cookie holding the BI app server affinity was invalid (it had already expired) the Load Balancer sends them to any BI app server. If it’s not the one that they authenticated against then BI tries to authenticate them again, but they don’t have the acf URL string (which comes through in the initial EBS click through to BI), and hence the “The session variable, NQ_SESSION.ACF, has no value definition.” error in the NQServer.log and “You are not logged in” error shown to the user.

As soon as the date was fixed on the load balancer cookies were served properly, we brought up both Presentation Services, and everything worked again. Phew.

Footnote: I cannot recommend this tool highly enough : Fiddler2. It makes tracing HTTP traffic, request headers, cookies, etc, a piece of cake (cookie?).

December 9, 2009

Troubleshooting Presentation Services / analytics connectivity

Filed under: obiee, sawping, sawserver — rmoff @ 11:56

Short but sweet this one – a way of troubleshooting connectivity problems between analytics (the Presentation Services Plug-in, either j2ee servlet or ISAPI, a.k.a. SAWBridge) and sawserver (Presentation Services).

For a recap on the services & flow please see the first few paragraphs of this post.

Problems in connectivity between analytics and sawserver normally manifest themselves through this error message:

500 Internal Server Error
Servlet error: An exception occurred. The current application deployment descriptors do not allow for including it in this response. Please consult the application log for details.

Which IE and Firefox render something like this:

At this stage all this means is the analytics plugin, i.e. the J2EE or ISAPI servlet, has thrown an error. That is all. Now, 95% of the time this will be because Presentation Services isn’t running, either by design (i.e. you forgot to start it) or because it’s barfed (in which case you need to check its log files etc and fix the problem).

Analytics logfile

Best practice demands a logical approach, so rather than rushing off to Presentation Services, take moment to examine the analytics logfile. For OAS or OC4J you’ll normally find this in $J2EE_HOME/home/application-deployments/analytics/home_default_group_1/application.log (where $J2EE_HOME will be the j2ee directory underneath your OAS or OC4J installation folder). Open up the logfile and navigate to the bottom of it, and work up it backwards until you get a date and timestamp and a message like this:

09/12/09 09:38:30.885 analytics: Servlet error

The next line(s) will tell you what the problem is, followed by a bunch of generic java gibberish and stack. Ignore the latter and pick out the action error, which will often be:

java.net.ConnectException: Connection refused

or sometimes:

java.net.ConnectException: Connection timed out

(Does anyone have additional errors to add in here?)

Troubleshooting

The errors are often self-explanatory (so long as you understand the architecture); “Connection refused” means that analytics tried to connect to sawserver and couldn’t. Once the problem is established then it’s a case of working through in a logical manner to determine the cause.
Connection refused is 95% of the time simply that Presentation Services (sawserver) isn’t running. Or maybe it is running, but on a different host or port than analytics is looking for.

To check where analytics is going to be looking for sawserver, examine the analytics configuration file $J2EE_home/applications/analytics/analytics/WEB-INF/web.xml (different for ISAPI, see last paragraph here).
There’ll be configuration lines matching one of these two examples. The default is this:

<init-param>
<param-name>oracle.bi.presentation.sawserver.Host</param-name>
<param-value>localhost</param-value>
</init-param>
<init-param>
<param-name>oracle.bi.presentation.sawserver.Port</param-name>
<param-value>9710</param-value>
</init-param>

A customised (e.g. for <a href="clustered resilience) entry may look like this:

<init-param>
<param-name>oracle.bi.presentation.sawservers</param-name>
<param-value>BISandbox01:9710;BISandbox02:9710</param-value>
</init-param>

sawserver

Let’s check the connectivity from both sides. First off, is Presentation Services (sawserver) running on the server we’re expecting it to be and listening on the correct port? In unix we can check this quite simply using the ps command and filtering it with the grep command. On the host that we’re expecting sawserver to be, run this:

$ ps -ef|grep sawserver
oracle   14827     1  0 09:58 pts/0    00:00:00 /bin/sh /app/oracle/product/obiee/setup/sawserver.sh
oracle   14842 14827 35 09:58 pts/0    00:00:01 /app/oracle/product/obiee/web/bin/sawserver

If there’s no output from this (or only the grep itself) then sawserver’s not running, and you need to fix that before proceeding.
On Windows check the Services window (services.msc) and task manager for sawserver.exe.

Assuming sawserver is running, now check that it is listening on the port specific in the analytics configuration file (see above). In this example, I’m checking for the default port, 9710:

$ netstat -a|grep 9710
tcp        0      0 *:9710                      *:*                         LISTEN

If there’s no output from the command then it means that port 9710 is not in use, i.e. sawserver is not listening on it. N.B. at this point it is theoretically possible that another application is using port 9710 – all we’re proving is that something is using it. But unless you’ve changed sawserver’s port (in instanceconfig.xml) then the fact it’s started up means that it is it using 9710 because it won’t start if another application is using its port.
In Windows you can use netstat -a but there’s no grep by default so you need to scroll down the output to look for the port.

So – sawserver is running on the expected host, and listening on the correct port.

analytics

Now let’s examine connectivity from the point of view of the analytics plugin (which is flow of the traffic too, i.e. connecting TO sawserver).
On the server hosting your application server (OAS/OC4J/IIS, etc) -which may or may not be the same as your Presentation Services – we want to test if Presentation Services can be connected to at the network layer. To do this we’re going to prod the port and host that it’s configured on (according to web.xml, see above).

The following is on OEL 4, which is a based on RedHat so I’d expect that to behave the same.
First get a “control” output for connecting to a port that most definitely is not open to traffic. Find a port on your sawserver host (which may or may not be local) that’s unused:

$ netstat -a|grep 9999
$

If you get output from the netstat then pick another port until you don’t
Now let’s try connecting to it to see what happens when we connect to a closed port:

$ telnet localhost 9999
Trying 127.0.0.1...
telnet: connect to address 127.0.0.1: Connection refused

So – our control output for a closed port is this telnet: connect to address 127.0.0.1: Connection refused.

Recall what host and port we determined analytics was trying to connect to (from web.xml, see above), and run the test for it. In this example I’ll check for the default – localhost and 9710.
If we get something like this:

$ telnet localhost 9710
Trying 127.0.0.1...
Connected to localhost.
Escape character is '^]'.

then it shows the port and host is accepting connections. You can’t do much more from here that I’m aware of, but it proves the port is open.

However if we get this:

$ telnet localhost 9710
Trying 127.0.0.1...
telnet: connect to address 127.0.0.1: Connection refused

then it would tell us that the port we’re expecting to be open isn’t – and you have a problem! See below for further suggestions.

On Windows you’ll get similar behaviour for a failed connection:

C:\>telnet localhost 9999
Connecting To localhost...Could not open connection to the host, on port 9999: Connect failed

For a successful connection you will normally find the command window clears and you get a flashing cursor. Enter a few random characters or hit Ctrl-C to return to the command prompt.

Further troubleshooting

If you get a connection error when you telnet to the host and port that you think sawserver should be on then you have identified the problem, and now need to diagnose the cause.
Starting points for this are:

  • If you’re not using an IP then check if the hostname resolves correctly. Try pinging it. If it doesn’t ping then you have general connectivity problems outside of OBIEE and need to speak with your network team to resolve them.
  • If the host pings but the port still is not accessible is it being blocked by a firewall?

There’s an interesting case study around this problem here, and an unsolved one here.

Summary

This is a fairly low-level way of methodically picking your way through problems between two of the OBIEE components.
As I’ve said, 95% of the time it’s a simple thing, that Presentation Services isn’t running. However hopefully this article gives you more of a basis on which to diagnose and solve the remaining 5% of issues.
If you can’t telnet to sawserver’s host and port from the machine that your application service is running on then your problem lies in connectivity and you need to fix that before trying to fix anything else.

Footnote – sawping

Just after writing this article I remembered a utility called sawping that I first saw mentioned by Srinivas Malyala here. In essence it does the same as what I documented using telnet above – it tests for sawserver on a given hostname and port.
I’d be interested to know if it does any more than check for the open port (i.e. does it interrogate the application on the end of the port to check it is sawserver). Watching saw.rpc entries to the sawserver.log it doesn’t look like it, or if it does it’s not logged.

To use it in unix you need to dot-source $OBIEE_HOME/setup/sa-init.sh (or sa-init64.sh) first to set your environment variables and paths:

$ . ./sa-init.sh
$

Test the default hostname and port (I don’t think this parses analytics’ web.xml):

$sawping
Server alive and well

Add the -v flag for more verbose output if you get an error:

$ sawping
Unable to connect to server. The server may be down or may be too busy to accept additional connections.

$ sawping -v
Unable to connect to server. The server may be down or may be too busy to accept additional connections.
An error occurred during execution of "connect". Connection refused [Socket:3]
Error Codes: ETI2U8FA

Test for sawserver on a different host:

$ sawping -s bisandbox02
Server alive and well

Note the message tells you what the problem is if there is an error (in this example, “Unable to resolve address”)

$ sawping -s bisandboxxxxx02 -v
An error occured during process. Run in verbose mode to see error details.
Unable to resolve the address for bisandboxxxxx02.
Error Codes: AXSBMN8D:

TRY_AGAIN

Test for sawserver on a different host and port:

$ sawping -s bisandbox02 -p 9711 -v
Server alive and well

To use the utility in Windows either add $OBIEE_Home/web/bin to your PATH environment variable, or reference it directly. The argument syntax remains the same:

C:\>c:\OracleBI\web\bin\sawping.exe
Server alive and well

C:\>c:\OracleBI\web\bin\sawping.exe  -s bisandbox02
Server alive and well

C:\>c:\OracleBI\web\bin\sawping.exe -p 9711 -v
Unable to connect to server. The server may be down or may be too busy to accept additional connections.
An error occurred during execution of "connect". No connection could be made because the target machine actively refused it.
 [Socket:1808]
Error Codes: ETI2U8FA

November 17, 2009

Resolved: sawserver : Error loading security privilege /system/privs/catalog/ChangePermissionsPrivilege

Filed under: config, sawserver — rmoff @ 17:19

Whilst installing OBIA 7.9.6.1 I hit this problem when firing up Presentation Services (sawserver):

Error loading security privilege /system/privs/catalog/ChangePermissionsPrivilege.

A quick search on the forums threw up two posts suggesting a corrupted WebCat.

Since I’d got this webcat fresh out of the box I was puzzled how it could be corrupted.

I did a bit more tinkering (including nosying around in the sawserver log), before realising it was indeed corrupt, and that I was indeed a muppet.

Here’s what happened after copying EnterpriseBusinessAnalytics.zip to my (unix) Presentation Services box:


$unzip EnterpriseBusinessAnalytics.zip 
Archive:  EnterpriseBusinessAnalytics.zip
   creating: root/
   creating: root/
   creating: root/shared/
   creating: root/shared/automotive/
   creating: root/shared/automotive/prompts/
  inflating: root/shared/automotive/prompts/gf_model+model+year+trim  
  inflating: root/shared/automotive/prompts/gf_model+model+year+trim.atr  
  inflating: root/shared/automotive/prompts.atr  
[...]
[ lots of files here ]
[...]
  inflating: root.atr                

$ls -l
total 110494
-rw-------   1 user   group    37655058 Oct  7 03:44 EnterpriseBusinessAnalytics.zip
drwx------   5 user   group       1024 Sep 18 01:06 root
-rw-------   1 user   group         60 Dec  6  2006 root.atr

Huh? What gives? Where’s my EnterpriseBusinessAnalytics web cat folder?
Well, quite obviously it’s unpacked it without a parent directory name.
That’s easily solved:

$mkdir EnterpriseBusinessAnalytics
$mv root EnterpriseBusinessAnalytics

Then I started up Presentation Services and got the error “Error loading security privilege /system/privs/catalog/ChangePermissionsPrivilege.”

If you can spot my snafu at this point the my only defence is that there was quite a lot of other gumf in the catalog folder, not just the files illustrated above 😀

The solution

Whilst I’d moved the root folder into my webcat folder, I’d neglected to move root.atr – in effect corrupting the web catalog.

So simple, but so frustating!

The solution in this case was to move root.atr into the webcat folder, alongside root.
It’s worth noting that this may not be the solution in all occurrences of this error, it depends on where the corruption has occurred.

Footnote

The silver lining being a good chance to poke around inside sawserver a bit more and discover gems like this in the logging:

The Oracle BI Presentation Server is proudly running under user: TODO_implement_this

It’s nice that it takes pride in its work, although shame we never get to find out the user’s name 😉

November 6, 2009

OBIEE clustering – specifying multiple Presentation Services from Presentation Services Plug-in

Filed under: load balancing, OAS, obiee, sawserver, unix — rmoff @ 12:00

Introduction

Whilst the BI Cluster Controller takes care nicely of clustering and failover for BI Server (nqsserver), we have to do more to ensure further resilience of the stack.

A diagram I come back to again and again when working out configuration or connectivity problems is the one on P16 of the Deployment Guide. With this you can work out most issues for yourself through simple reasoning. Print it out, pin it to your wall, and read it!

As a reminder, when a user calls up the address for Answers or Dashboards the flow goes :

  1. web browser
  2. web serve r (eg OAS – Apache)
  3. app server (eg OAS – OC4J) -> BI Presentation Services Plug-in (“analytics”)
  4. BI Presentation Services
  5. (BI Server)
  6. (Database)

With clustering we are aiming to spread the load as much as possible. This gives us resilience if a component fails and capacity as the work is shared out.

This posting examines how to configure step 3 on the above list (BI Presentation Services Plug-in) to work with multiple BI Presentation Services.

From the Deployment Guide:

BI Presentation Services Plug-ins route session requests to BI Presentation Services instances using native protocol. The connections are load balanced using native load balancing capability.

BI Presentation Services receives requests from BI Presentation Services Plug-in […]. Although an initial user session request can go to any BI Presentation Services in the cluster, each user is then bound to a specific BI Presentation Services instance.

Be aware that “BI Presentation Services” is not the same as “BI Presentation Services Plug-in”:

  • “BI Presentation Services” is sawserver, a service in its own right.
  • “BI Presentation Services Plug-in” is a java servlet called analytics deployed within a J2ee application server.
    • There is also a version for IIS using ISAPI. This article is only about the j2ee version. The configuration principles should remain the same for the ISAPI plugin though.

Configuration

To configure the j2ee plug-in, do the following:

  1. Locate web.xml found in $J2EE_home/applications/analytics/analytics/WEB-INF
    • See note below regarding this path as it is contrary to that given in the Deployment Guide on p35
  2. Create a backup of the web.xml file
  3. By default the file will have two sets of init-params. Remove these:
    <init-param>
    <param-name>oracle.bi.presentation.sawserver.Host</param-name>
    <param-value>localhost</param-value>
    </init-param>
    <init-param>
    <param-name>oracle.bi.presentation.sawserver.Port</param-name>
    <param-value>9710</param-value>
    </init-param>
    
  4. Add in a new init-param in place of the two you removed, specifying your Presentation Services hosts and ports (syntax is host:port) in a semi-colon delimited list
    <init-param>
    <param-name>oracle.bi.presentation.sawservers</param-name>
    <param-value>BISandbox01:9710;BISandbox02:9710</param-value>
    </init-param>
  5. Save your modified web.xml file
  6. Restart your application server
    • In OAS you can use opmnctl restartproc
  7. Login to Answers and test that it works
  8. Stop one of your Presentation Services (sawserver)
  9. Refresh Answers. You’ll probably get a 500 Internal Server Error.
    • If you check the application.log it shows that it can’t connect to the Presentation Services (because you’ve just stopped it, duh!)
  10. Refresh Answers again in a minute or two. You should get Presentation Services back, but from a different instance.
    • Does anyone know where this period is defined, eg is it a timeout setting, multiple failed connection attempts?
  11. Work through all your Presentation Services servers, stopping and starting the service on each to ensure each is being picked up

How do you know which Presentation Services you’re using?

This is where it can get a bit confusing!

The images that you see rendered on the page are local to the BI Presentation Services Plug-in. So if you muck around with the files in /res you can tag the login page with the server that analytics plugin is running on. If you’re not using web server load balancing then this will always be the web server that you’re connecting to.

The web catalog is specified by the BI Presentation Services instance. Once your clustering is setup then obviously you must share or replicate your web catalog. However whilst setting up the plugin->presentation services connectivity it might be an idea to have separate instances. Set up the default dashboard on login simply to show the Presentation Sevices server name as a text box (hardcode it). Do this for each server. You can go and check the actual Request in the web catalog on each server’s file system to make sure you’re on the right one.

Logfiles

  • BI Presentation Services Plug-in:
    •  $J2EE_home/application-deployments/analytics/home_default_group_1/application.log
    • Also available through OAS’s Enterprise Manager, click Logs link top right and navigate to the analytics Application
  • BI Presentation Services:
    • $OracleBIData/web/log/sawlog0.log

Common errors

500 Internal Server Error

Servlet error: An exception occurred. The current application deployment descriptors do not allow for including it in this response. Please consult the application log for details.

BI Presentation Services Plug-in has thrown an error, and you should check its logfile (see below).

analytics: Servlet error java.net.ConnectException: Connection refused

The BI Presentation Services Plug-in is trying to connect to a Presentation Services and can’t. Either you’ve specified the wrong host or port details in the web.xml, or Presentation Services (sawserver) is not running.

Internal Server Error

The server encountered an internal error or misconfiguration and was unable to complete your request.

This typically means that the BI Presentation Services Plug-in is not running. Check in OAS that the analytics application is started

Bonus – shared config

In researching this I found an interesting point in the 10.1.3.4.1 release notes. You can specify the analytics configuration in a shared config file using the oracle.bi.presentation.sawbridge.configFilePath param-name.

On a clustered setup with shared filesystem you can therefore have one file listing the Presentation Services servers to use, and reference this from each analytics config.

Ref: Configuring Oracle BI EE Using an EAR File

web.xml location

The Deployment Guide p35 states that the web.xml for java servlet is $OracleBI_HOME/web/app/WEB-INF. However, in my experience this should actually be $J2EE_home/applications/analytics/analytics/WEB-INF.

The table on p97 in the Infrastructure Installation and Configuration Guide concurs with this, and shows different locations for web.xml. The difference is whether your installation using IIS or OAS/OC4J.

So for OAS/OC4J web.xml is $J2EE_home/applications/analytics/analytics/WEB-INF, and for IIS’s ISAPI plugin it is $OracleBI_HOME/web/app/WEB-INF

September 15, 2009

OBIEE cluster controller failover in action

Filed under: cluster, load balancing, obiee, performance, sawserver, unix — rmoff @ 15:06

Production cluster is 2x BI Server and 2x Presentation Services, with a BIG-IP F5 load balancer on the front.

1pub

Symptoms

Users started reporting slow login times to BI.
Our monitoring tool (Openview) reported that “BIServer01 may be down. Failed to contact it using ping.”.
BIServer01 cannot be reached by ping or ssh from Windows network.

Diagnostics

nqsserver and nqsclustercontroller on BIServer01 was logging these repeated errors:

[nQSError: 12002] Socket communication error at call=send: (Number=9) Bad file number

Whether OBIEE was running on BIServer01 or not, users could still use OBIEE but with a delayed login.

Majority of the login time spent on the OBIEE “Logging in … ” screen, which is not normally seen because login is quick.

Network configuration issues found on BIServer01.

Initial suspicion was that EBS authentication was the cause of the delay, as this is only used at login time so would fit with the behaviour observed. They checked their system and could see no problems. They also reported that the authentication SQL only hit EBS just before OBIEE logged in.

Diagnosis

Using nqcmd on one of the Presentation Services boxes it could be determined that failover of Cluster Controllers was occuring, but only after timing out on contacting the Primary Cluster Controller (BIServer01).
2pub

[biadm@PSServer01]/app/oracle/product/obiee/setup $set +u
[biadm@PSServer01]/app/oracle/product/obiee/setup $. ./sa-init64.sh
[biadm@PSServer01]/app/oracle/product/obiee/setup $nqcmd

-------------------------------------------------------------------------------
Oracle BI Server
Copyright (c) 1997-2006 Oracle Corporation, All rights reserved
-------------------------------------------------------------------------------

Give data source name: Cluster64
Give user name: Administrator
Give password: xxxxxxxxxxxxx
[60+ second wait here]

This conclusion was reached because after setting PrimaryCCS to BIServer02 there was no delay in connecting. I changed the odbc.ini entry for Cluster64 to switch the CCS server order around
[…]
PrimaryCCS=BIServer02
SecondaryCCS=BIServer01
[…]

[biadm@PSServer01]/app/oracle/product/obiee/setup $nqcmd

-------------------------------------------------------------------------------
Oracle BI Server
Copyright (c) 1997-2006 Oracle Corporation, All rights reserved
-------------------------------------------------------------------------------

Give data source name: Cluster64
Give user name: Administrator
Give password: xxxxxxxxxxxxx
[logs straight in]

Any changes to odbc.ini have to be followed by a bounce of sawserver.

Resolution

To fix the slow login for users whilst the network problems were investigated I switched the order of CCS in the odbc.ini configuration and bounced each sawserver:
3pub
For the end-users the problem was resolved as they could now log straight in.
However at this stage we’re still running with half a cluster. If BIServer02 had failed at this point then the BI service would have become unavailable.

The root-cause was a network configuration error on the four servers combined with a possible hardware failure.

Summary

Ignoring Scheduler, a two-machine OBIEE cluster has an Active:Active pair of BI Servers. Analytics traffic to these servers is routed via an Active:Passive pair of Cluster Controllers.

The client (eg sawserver) uses ODBC config syntax to define which Cluster Controller to try contacting first. This is the PrimaryCCS. If it connects then the PrimaryCCS will return the name of the BI Server to the client, which will then send all subsequent ODBC connections to the BI Server direct.

If the client cannot connect to the PrimaryCCS in the time defined it will try the SecondaryCCS instead. The SecondaryCCS behaves exactly the same as the PrimaryCCS – it returns the name of the BI Server to the client for direct ODBC connection.

The Cluster Controller maintains the state of the BI Servers and if one becomes unavailable will know not to route any Analytics traffic to it.

The failover of the Cluster Controller itself is stateless, it is local only to the client session context. This means that each new client session has to go through the failover from Primary to Secondary CCS with the associated timeout delay.

[update 21st Sept] I’ve tested out the same configuration over four VM OEL 4 servers, and cannot reproduce the delayed login time. When one CCS is taken down failover to the other appears almost instantaneous [/update]

FinalTimeOutForContactingCCS

odbc.ini has the parameter FinalTimeOutForContactingCCS set to 60 seconds. Changing this to a lower value does NOT appear to reduce the failover time.

August 25, 2009

Multiple RPDs on one server – Part 2 – Presentation Services

Filed under: hack, obiee, sawserver — rmoff @ 16:13

Introduction

In this article I plan to get sample and paint repositories hosted on a single server, using one BI Server instance and two Presentation Services instances. This is on both Unix (OEL 4) and Windows, and both OC4J (OBIEE’s “basic installation” option) and OAS (“Advanced Installation”).

Make sure you’ve read and followed part 1 – BI Server first.

Remember that multiple Presentation Services instances on a machine is UNSUPPORTED BY ORACLE!

OBIEE Components

See the deployment guide p.11 for a thorough explanation of the components.

It’s important to understand the components of the OBIEE stack as what we’re doing is unsupported and undocumented in parts, so you need to be able to diagnose and reason through issues you may get:

  • BI Server (nqserver) – the Analytics server. Uses the RPD to build queries to send to the database.
  • Presentation Services (sawserver) – This takes the submission of queries from Answers/Dashboards and sends them by ODBC to the BI Server. It handles the rendering of the returned data.
  • Presentation Services Plug-in (analytics) – This is a J2EE application deployed in on an application server such as Oracle Application Server or OC4J. It handles server-side calls from the Answers or Dashboards webpage.

What we do is deploy a second instance of the Presentation Services Plug-in (analytics) and configure it to talk to a second invocation of Presentation Services (sawserver) which is run with a new configuration.

NB contrary to other posts on this subject that I’ve seen, you don’t need to install a second instance of presentation services – you just fire up your existing one with a different configuration file.

Deploy a second instance of Presentation Services Plug-in (analytics)

This is for OAS and OC4J, with another application server YMMV.

  • Login, at http://:/em/ (common ports are 7777 or 9704) (see here for info on resetting login details it if you don’t know the login)
  • [OAS only] Assuming you’re now on the “Cluster Topology” screen, click through to the OC4J home (under Members click the link where in the Type column it says OC4J)Oracle Enterprise Manager (oc4jadmin) - Cluster Topology_1251187606945
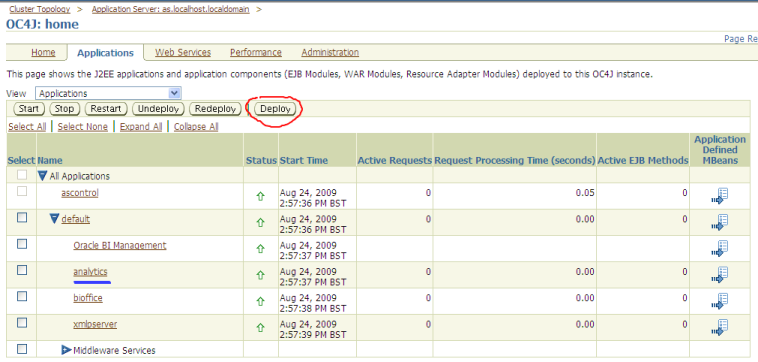
  • Assuming you’re now on OC4J: home click the Applications link. (You should see one instance of analytics already deployed.)
  • Click on the Deploy button oc4jhome
  • For the next step, determine where on your server analytics.war is (by default it will be $OracleBI/web/analytics.war).
  • On the Deploy: Select Archive page tick “Archive is already present on the server where Application Server Control is running.” and enter the full path to analytics.war. Under Deployment Plan leave “Automatically create a new deployment plan” ticked. Click Next.Oracle Enterprise Manager (oc4jadmin) - Deploy- Select Archive_1251188864123
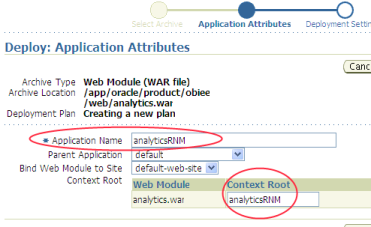
  • On the Deploy: Application Attributes page change Application Name and Context Root to whatever you want to access the new instance by. For example, if you currently go to http://localhost:7777/analytics you could choose http://localhost:7777/analyticsInstanceB. In this example I’m going to use analyticsRNM. Click Next.Oracle Enterprise Manager (oc4jadmin) - Deploy- Application Attributes_1251189838584
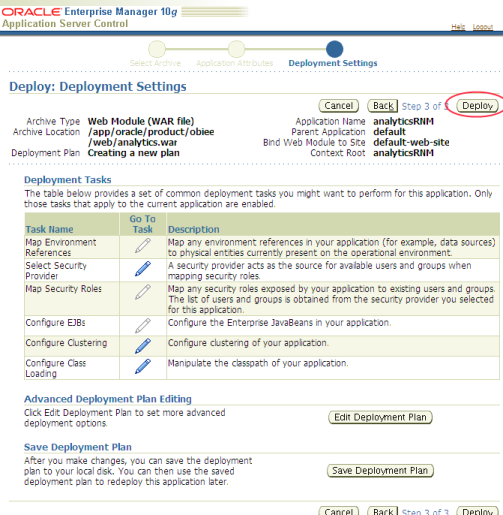
  • On the Deploy: Deployment Settings page you shouldn’t need to change anything. Click Deploy.Oracle Enterprise Manager (oc4jadmin) - Deploy- Deployment Settings_1251190127915
  • Hopefully you’ll get a successful deployment:Oracle Enterprise Manager (oc4jadmin) - Confirmation_1251190541184Take note of the path listed as “Copy the archive to” in the output. This gives you the j2ee home, which you’ll need in a minute. In this example:
    [25-Aug-2009 09:51:33] Copy the archive to /app/oracle/product/10.1.3.1/OracleAS_1/j2ee/home/applications/analyticsRNM.ear

    the J2EE home dir is

    /app/oracle/product/10.1.3.1/OracleAS_1/j2ee/home
  • Click Return, and on your OC4J: home you should now have a second analytics listedOracle Enterprise Manager (oc4jadmin) - OC4J- home_1251191169012

Setting up a second Presentation Services

You need to create a second Presentation Services that will have its own web catalog and configuration to use the correct RPD.
In this example I’ll create a new Presenttion Services which will be for samplesales whilst the original default installation will be for paint.

An important note is that we don’t need to install anything new, we simply use the existing installation with separate configurations (instanceconfig.xml) and web catalog. The next steps assume that you already have the web catalog for samplesales and just cover instanceconfig.xml

In $OracleBIData/web/config create a copy of instanceconfig.xml for your new instance, eg. instanceconfigRNM.xml. Edit it as follows:

  • Set the CatalogPath to the web cat for samplesales
  • Set the DSN to the ODBC connection you defined above for samplesales
  • Under the <ServerInstance> tag add <Listener port=”9711” />. Set the listener port to port that is not currently in use. Remember what you set it to, as you’ll need to update the Presentation Services plugin with it (see below). In unix you can’t use below 1024 unless you’re root (which you shouldn’t be running OBIEE as!).

Be aware that instanceconfig.xml is CaSe SENsiTIve. Thanks to Merlin128 for discovering this 🙂 This can lead to problems as you won’t always get an error. If you use catalogpath (instead of CatalogPath) you’ll get an error, but if you use Listener Port (capital P, should be lowercase) you won’t get an error but sawserver will ignore it and default to port 9710.

Your modified file should look something like this:

<?xml version="1.0" encoding="utf-8"?>
<WebConfig>
   <ServerInstance>
   <Listener port="9711"/>
   <DSN>AnalyticsWebSampleSales</DSN>
   <CatalogPath>/data/web/catalog/samplesales</CatalogPath>
[...]

(NB: following the instructions in “Changing the BI Presentation Services Listener Port” in the deployment guide p.141, I got an error when I tried to embed the Listener tag within RPC: “The configuration entry ‘RPC/Listener’ is deprecated. Please refer to the admin guide for more information.” followed by an Assertion failure. Putting it just within ServerIntance worked fine)

Testing the second instance of Presentation Services (sawserver)

sawserver can be started with command line parameters, one of which is to specify the config file (which defaults to $OracleBIdata/web/config/instanceconfig.xml). Ultimately we’ll package this up neatly, but to avoid complications it’s best to run it natively from the commandline first to make sure it’s working and not hide any output which may be helpful.

Windows

From the commandline go to $OracleBI\web\bin (eg. C:\OracleBI\web\bin) and enter:
sawserver.exe -c c:\OracleBIData\web\config\instanceconfigRNM.xml
(amend c:\OracleBIData\web\config\instanceconfigRNM.xml as appropriate to point to the new instanceconfig.xml file you created above).
Make sure you get a successful startup:

Type: Information
[…]
Oracle BI Presentation Services 10.1.3.4.1 (Build 090414.1900) are starting up.
—————————————
Type: Warning
[…]
WARNING: The Oracle BI Presentation Server is running on a workstation class machine (Windows 2000 Workstation, Windows XP Professional, etc
.). Number of concurrent users may be severely limited by the operating system.
—————————————
Type: Information
[…]
Oracle BI Presentation Services have started successfully.

Unix

From the shell prompt go to $OracleBI/setup and run

. ./sa-init.sh
sawserver -c /data/web/config/instanceconfigRNM.xml

Points to note:

  • common.sh and sa-init.sh are “dot sourced”, i.e. type exactly: dot space dot slash
  • If you’re on 64 bit then run sa-init64.sh and sawserver64 instead of sa-init.sh and sawserver respectively
  • amend /data/web/config/instanceconfigRNM.xml as appropriate to point to the new instanceconfig.xml file you created above

Make sure you get a successful startup:

Type: Information
[…]
Oracle BI Presentation Services 10.1.3.4.1 (Build 090414.1900) are starting up.
—————————————
Type: Information
[…]
Oracle BI Presentation Services have started successfully.

Configuring the new Presentation Services plugin

You need to configure the new Presentation Services plugin (eg analyticsRNM) so that it can communicate with the second instance of Presentation Services.

  • Go to your J2EE home directory (if you didn’t note it down below, in OC4J go logs in the top right corner and then click on View for one of the logs, this should give you the path to j2ee/home). Under applications (not application-deployments) go to whatever you called your new instance (eg analyticsRNM), then analytics, then WEB-INF
    eg.

    /app/oracle/product/10.1.3.1/OracleAS_1/j2ee/home/applications/analyticsRNM/analytics/WEB-INF

    or

    C:\OracleBI\oc4j_bi\j2ee\home\applications\analyticsRNM\analytics\WEB-INF\
  • Make a backup copy of web.xml
  • Open web.xml in your favourite text editor and search for oracle.bi.presentation.sawserver.Port. On the line below there will be the default port of 9710. Change this to the new value that you defined above in Setting up a second Presentation Services (in that example it was 9711). It’s very important to get this bit right!webxm
  • In OC4J Application list restart the new instance (eg analyticsRNM), or restart the whole of OC4J/OAS to make doubly-sure.

Testing the configuration

For good measure, first bounce both BI Server and your web/application server (eg OC4J, OAS) if you haven’t already.

Then start both versions of Presentation Services (either manully or scripted, see below). Check that they’ve started up correctly by checking sawserver.out.log, and check they’re listening on the correct ports (eg 9710 and 9711):

tcp

Note about ports: don’t confuse these Presentation Services ports with your web server ports. You will always connect from your web browser to your web server on the same port, eg. 9704 or 7777. You would never enter the ports 9710 etc in your web browser address bar.

Start BI server if it’s not running, and then navigate to http://%5Bweb server]:[web server port]/analytics (eg http://localhost:7777/analytics) and login and ensure that you get paint (or whatever you’ve left your default instanceconfig.xml pointing to).

Now try http://%5Bserver%5D:%5Bport%5D/%5Bnew analytics] eg. http://localhost:7777/analyticsRNM and login and hopefully you’ll get samplesales (or whatever your new instanceconfig.xml points to).

samplesales.rpd in one window, paint.rpd on the other, both running from one server

samplesales.rpd in one window, paint.rpd on the other, both running from one server

Problems you might encounter

When doing this amount of configuration work it never does any harm to throw in cheeky service restart to see if it resolves an error. It’s probably good practice to try and work through an error first, if only for gathering understanding.

500 Internal Server Error

Servlet error: An exception occurred. The current application deployment descriptors do not allow for including it in this response. Please consult the application log for details.
This is a generic message meaning that the Presentation Services plugin (“analytics”) has thrown an error. To find details either get the log file from disc ($J2EE home/application-deployments//home_default_group_1/application.log) or from OC4J: homeOracle Enterprise Manager (oc4jadmin) - Log Files_1251205732988
From the log file you can get the real error message of what’s going on

Port 9710 is in use on the local system

Check that you’re starting sawserver directly, and not using sawserver.sh.
If you use sawserver.sh then your -c argument will be ignored because sawserver.sh calls the sawserver binary without any arguments.

Doublecheck your customised instanceconfig.xml file, because sawserver won’t necessarily flag an error if it’s invalid, it will just revert to default values including port (9710).

Your new analytics instance shows the same repository as the default one

You analytics is probably connecting to the incorrect Presentation Services, or the Presentation Services it is connecting to is not running with the correct instanceconfig.xml file

  • What port is Presentation Services plugin (analytics) looking for Presentation Services (sawserver) on? see $J2EE home/applications/[your analytics]/analytics/WEB-INF/web.xml and check the param-value for oracle.bi.presentation.sawserver.Port
  • Shut down all Presentation Server (sawserver) instances that aren’t configured to serve the port in question. Use netstat to verify that the port is state LISTEN
  • Try logging in again – if you get the login screen then you’re connecting to Presentation Services correctly, so the problem must be with the configuration there
  • Check the instanceconfig file that the Presentation Services is started with, have you updated DSN, CatalogPath and Listener Port as described above?

java.io.EOFException at com.siebel.analytics.web.sawconnect.sawprotocol.SAWProtocol.readInt

09/08/25 14:04:50.46 analytics: Servlet error
java.io.EOFException
at com.siebel.analytics.web.sawconnect.sawprotocol.SAWProtocol.readInt(SAWProtocol.java:167)
at com.siebel.analytics.web.sawconnect.sawprotocol.SAWProtocolInputStreamImpl.readChunkHeader(SAWProtocolInputStreamImpl.java:232)

This means that the Presentation Services plugin (analytics) cannot communicate with Presentation Services (sawserver).
Check:

  • What port is analytics configured to use? see $J2EE home/applications/[your analytics]/analytics/WEB-INF/web.xml and check the param-value for oracle.bi.presentation.sawserver.Port
  • Is Presentation Services (sawserver) started?
  • Is Presentation Services (sawserver) listening on the same port as is configured in analytics’ web.xml? Check the instanceconfig file that sawserver was started with, and use netstat -a to check if it’s state LISTEN or not
  • If all of these look correct, try bouncing your application server (OC4J, OAS, etc)

[nQSError: 10058] A general error has occurred. [nQSError: 12008] Unable to connect to port 9703 on machine localhost.

Whoops, you forgot to start your BI server…

Charts aren’t working, I just get a yellow triangle symbol

Is the Javahost service running?

Starting both Presentation Services neatly

Unix

run-saw.sh is the script used in Unix to control Presentation Services. You can examine it in $OracleBI/setup/run-saw.sh and create your own hack based on your requirements (eg if you always want both started, or to control them individually).

Be aware that run-saw.sh checks for an running instance of “sawserver” so you’ll need to cater for that.

One method would be to create a new startup script like this:

#!/bin/sh
#
# Hacky script to run two versions of Presentation Services
#
# https://rnm1978.wordpress.com/
#
# ---------------------------------------------------
# start your default Presentation Services
echo 'Starting default Presentation Services...'
echo ' '
run-saw.sh start
# The above should be "start64" if you're in 64 bit mode

# Now start the additional Presentation Services
echo '----'
echo ' '
echo 'Starting additional Presentation Services...'
echo ' '
. ./common.sh
. ./sa-init.sh
logfile="${SADATADIR}/web/log/sawserverRNM.out.log"
sawserver -c /data/web/config/instanceconfigRNM.xml  >> ${logfile} 2>&1 &
# The above should be "sawserver64" if you're in 64 bit mode
echo 'See '${logfile}' for log'

Stopping Presentation Services is easier, as run-saw.sh is ruthless in its approach and kills all instances of sawserver. If you don’t want this and want to target a specific instance you’ll need to use ps -ef|grep sawserver and kill the required process.

Windows

To add your new Presentation Services as a service in its own right using Microsoft’s sc, follow these steps.
This involves editing the registry! Do so at your own risk!

  1. From the commandline enter:
    sc create sawsvc2 binpath= SEARCHFORMEPLEASE displayname= "Oracle BI Presentation Server 2"
    

    (note the spaces after the equals character)

  2. Run regedt32 and search for SEARCHFORMEPLEASE
  3. Hopefully you’ll find HKEY_LOCAL_MACHINE\SYSTEM\CurrentControlSet\Services\sawsvc2
  4. Edit the ImagePath Value to “C:\OracleBI\web\bin\sawserver.exe” /service /c c:\OracleBIData\web\config\instanceconfigRNM.xml (replacing paths where appropriate)reg
  5. Go to Services and you should see Oracle BI Presentation Server 2 which when started should bring up your new Presentation Services.services

(I couldn’t get sc to accept the full command hence the SEARCHFORME hack!)

If you don’t want to muck around with services something like this simple script should suffice. It uses PsExec (from the excellent PsTools suite of utilities) to start multiple sawserver instances in the background.

REM runMultiplePS.bat
REM
REM
REM Hacky script to run two versions of Presentation Services
REM
REM https://rnm1978.wordpress.com/
REM
REM Uses psExec, download it from http://technet.microsoft.com/en-us/sysinternals/bb896649.aspx
REM and put it somewhere in your PATH like c:\windows\system32
REM ---------------------------------------------------
REM Default instance. Comment this line out if you're running it from Services instead.
REM (you could include -c c:\OracleBIData\web\config\instanceconfig.xml  if you wanted, same difference)
psexec -d C:\OracleBI\web\bin\sawserver.exe
REM Additional instance:
psexec -d C:\OracleBI\web\bin\sawserver.exe -c c:\OracleBIData\web\config\instanceconfigRNM.xml
REM ---------------------------------------------------
REM paths will be something like C:\OracleBI\web\bin64\sawserver64.exe for 64-bit

Conclusion

Hopefully this article demonstrates clearly and in enough detail how to set up multiple Presentation Services, without overwhelming the reader. It is actually easy to do, and is great practice for understanding the architecture behind the OBIEE stack. Things to consider after this are the other shared resources (like javahost and logconfig.xml) which may want isolating depending on the use.

Remember that multiple Presentation Services instances on a machine is UNSUPPORTED BY ORACLE!

As well as working on multiple RPDs & Web Cats, this method could be used for one RPD but multiple web cats, maybe at different development levels, or as a sandbox for certain users. In that case the instanceconfig for each Presentation Services would specify the same ODBC DSN.

References / sources

Multiple RPDs on one server – Part 1 – the BI Server

Filed under: obiee, sawserver, unix — rmoff @ 16:12

Introduction

In this article I plan to get samplesales and paint repositories hosted on a single server, using one BI Server instance and two Presentation Services instances. This is on both Unix (OEL 4) and Windows, and both OC4J (OBIEE’s “basic installation” option) and OAS (“Advanced Installation”).

Both samplesales and paint are shipped with 10.1.3.4 of OBIEE, you’ll find them in $OracleBI/OracleBI/server/Sample. This article assumes you’ve got the RPD of each into $OracleBI/OracleBI/server/Repository and unpacked the web cats for each into $OracleBIdata/web/catalog.
It also assumes that you know your way around the architecture of BI and are familiar with NQSConfig.ini and instanceconfig.xml – if neither of those files mean anything to you then you will find some background reading useful.

Verify paint and samplesales RPDs

Check that both paint and samplesales both work independently before we start trying to get them to work alongside each other.

paint.rpd

Set NQSConfig.ini to

[ REPOSITORY ]
Star    =       paint.rpd ;

and instanceconfig.xml to

<CatalogPath>/data/web/catalog/paint</CatalogPath>

(assuming $OracleBIData is /data/web)

Restart BI Server and Presentation Services. Login and check you get something like this:

Oracle BI Interactive Dashboards_1251110032149

paint - default dashboard view

samplesales.rpd

Set NQSConfig.ini to

[ REPOSITORY ]
Star    =       samplesales.rpd ;

and instanceconfig.xml to

<CatalogPath>/data/web/catalog/samplesales</CatalogPath>

(assuming $OracleBIData is /data/web)

Restart BI Server and Presentation Services. Login and check you get something like this:

Oracle BI Interactive Dashboards_1251110222626

samplesales (navigate to dashboard 00 Overview and then report 1.1 - Multi Dim Top Ns)

If you don’t get these working then you need to before continuing. See here for information on setting up samplesales

Configuring both RPDs alongside each other

Edit the NQSConfig.ini file to :

[ REPOSITORY ]
samplesales =       samplesales.rpd , DEFAULT;
paint    =       paint.rpd ;

See page 201 of the Installation and Configuratino guide for the syntax, which is basically:
<logical name> = <filename>.rpd;
The default logical name is Star, but it doesn’t have to be this. If just one repository is loaded in BI Server then it will be connected to for all incoming connections, assuming you have left the Repository= statement as default in the odbc.ini configuration file.

It’s important to understand here how Presentation Services communicates with BI Server. The BI Server uses the ODBC protocol to communicate with all clients, and that includes Presentation Services. Don’t confuse this ODBC with the the protocol that BI Server uses to communicate with the database, which may or may not be ODBC (or OCI, etc). The configuration for Presentation Services communicating with BI Server is in instanceconfig.xml which defines the ODBC DSN to use in the WebConfig > ServerInstance > DSN tag.

ODBC config – Unix

The DSN is defined in $OracleBI/setup/odbc.ini. To test that BI Server is running both RPDs, add two new entries to your odbc.ini file, copying the existing AnalyticsWeb, and specifying the Repository in each:

[...]

[AnalyticsWebPaint]
[...]
Repository=Paint
[...]

[AnalyticsWebSampleSales]
[...]
Repository=SampleSales
[...]

ODBC config – Windows

The DSN is defined in the GUI ODBC Data Source Administrator (odbcad32.exe) under System DSNs, Driver type Oracle BI Server. As above create two new DSNs, one for Paint and one for SampleSales, and put the repository name in the “Change the default repository to” box. If you’ve updated your NQSConfig.ini as above and restarted BI Server then you should be able to tick “Connect to Oracle BI Server to obtasin defaultsettings […]” and click Next and get a successful connection.

Common errors

nQSError: 43004 repository name: is invalid : Review your NQSConfig.ini logical repository name (on the left of the config line, default is Star)
Path not found … Error Codes: U9KP7Q94: Check your CatalogPath is correct in instanceconfig.xml.

Testing the BI server with two RPDs

Update your instanceconfig.xml and change AnalyticsWeb for AnalyticsWebSampleSales, and make sure the CatalogPath is that of the samplesales webcat. Restart Presentation Services, and log in to Dashboards and verify that the samplesales repo is in use.

Do the same for Paint (update instanceconfig.xml to use AnalyticsWebPaint, and CatalogPath set to paint web repo).

Next steps

You’ve now got a single BI server hosting two repositories. See Part 2 – Presentation Services for setting up multiple Presentation Services to work with these repositories.

References / sources

August 21, 2009

OBIEE and Load Runner – part 2

Filed under: loadrunner, obiee, performance, sawserver — rmoff @ 12:24

UPDATED:
See a HOWTO for OBIEE and LoadRunner here: https://rnm1978.wordpress.com/2009/10/01/obiee-and-loadrunner-howto/


This is following on from my first post about OBIEE and LoadRunner, in which I failed dismally to get a simple session replaying.

In a nutshell where I’d got to was using the “Web (Click and Script)” function which worked fine for logging in but when running a report resulted in an error on the rendered page. Digging around showed the error was from the javascript of the OBIEE front end.

AJAX (Asynchronous Javascript And XML) is a combination of technologies but in essence lets a web page load once whilst refreshing its contents with calls back to the web server. In the context of OBIEE this means a dashboard page can load with placeholders for reports and as the data comes back (from the datasource via the BI Server and then parsed through sawserver) each dashboard report can update immediately, without the whole webpage reloading. I’m sure this is where the problem lies with LoadRunner, and it’s going to be important to get it right otherwise the numbers we get out won’t be reliable.

I checked Metalink 3 for any entries and Doc 496417.1 says that LoadRunner’s been used with OBIEE successfully before..

VUGen (LoadRunner Virtual User Generator) offers several protocols. I’d been working with “Web (Click and Script)” but after a fair bit of Googling tried “AJAX (Click and Script)” which didn’t work any better, and then “Web (HTTP/HTML)”.

In the Options dialog prior to Recording there are some Siebel correlations defined including one called Siebel_Analytic_ViewState. Correlation is how LoadRunner deals with a data in a session that is passed back to the server in a subsequent step. For example, at login a user might get a sessionID of some sort which the web server requires in any subsequent calls back. LoadRunner can automatically detect some of these, and you have to define the rest.
The correlations I picked up were:

  • _scid
  • ViewState

The replay still wasn’t working properly, the replay screenshots showed this error:
invalidstate

Using Fiddler2 again to analyse the traffic showed this pattern of requests/responses:

saw.dll?Dashboard This is the main dashboard with placeholders for content
saw.dll?DocPart&_scid=3QNnUBQ3IJo&StateID=943636977 this is a dashboard flash component
saw.dll?DocPart&_scid=3QNnUBQ3IJo&StateID=943636978 this is a dashboard flash component
saw.dll?DocPart&_scid=3QNnUBQ3IJo&StateID=943636979 this is a dashboard flash component
saw.dll?DocPart&_scid=3QNnUBQ3IJo&StateID=943636980 this is a dashboard flash component

The StateID in the URL is embedded in the dashboard template, and is unique so can’t be hardcoded in the VUser script. The script as recorded is hardcoding these numbers and thus requesting flash charts from a dashboard query long-gone, hence the very true “invalid state identifier”

LoadRunner has a feature called ContentCheck (accessed from the Run-time Settings dialog) which can be configured to halt the test if pre-defined text is found, so I added “invalid state identifier” and “! Error : Response from server contained an error” into it and clicked the Set as Default so they’d come up for each script from now
[edit] this doesn’t fire for “! Error : Response from server contained an error”, maybe because it’s inserted through ajax rather than the HTML response? [/edit]
contentcheck

After tinkering around a bit more I recorded another VUser, using “Web (Click and Script)” but on the Recording Options screen set it to URL mode instead of GUI. This captured all of the content requests (css, js, gif, etc), and gave a better replay:
replay03

The Help text explains:

  • “..GUI-based script option instructs VuGen to record HTML actions as context sensitive GUI functions such as web_text_link…”
  • “..URL-based script mode option instructs VuGen to record all browser requests and resources from the server that were sent due to the user’s actions. It automatically records every HTTP resource as URL steps (web_url statements). For normal browser recordings, it is not recommended to use the URL-based mode since is more prone to correlation related issues…”

(my emphasis)

Looking at the script it’s still got saw.dll?DocPart calls with a hardcoded StateID. This means that flash-content won’t be being returned. To an extent this doesn’t matter so long as it’s still being generated (i.e. imposing the desired load on the server), but it’s not a full simulation of user activity because there’s less network traffic as a result.

So using the URL-based mode generates better results (i.e. no server error) but looks pretty much hardcoded to the specific scenario recorded. It’s all very well getting a single dashboard working, but I want to simulate hundreds of users using tens of dashboards. In an ideal world I’d define a login action with parametrised username/password, then a dashboard navigation / refresh action with a parametrised list of dashboard titles, and then a logout action.

With the caveat here that I have no training in LoadRunner, it appears to my untrained eye that the only way I’m going to get repeatable, reusable scripts is using the GUI recording, that is, using the web_text_link function to simulate a user clicking, rather than the web_submit_data function which simulates the POST behaviour of ajax but is specific to the dashboard in question and needs some hardcore LR coding to correlate IDs embedded in the HTML with server requests to populate them.

Going back to the Click and Script (GUI Mode) and Fiddler2 I did a line-by-line comparison of the Fiddler-captured HTTP traffic between the recording session and replay. The login action was the same. The clicking onto the dashboard was as follows:
fiddler
This shows that the initial dashboard request works, and that the first “ReloadDashboard” ajax call correctly retrieves some of the data, but (a) this isn’t ‘rendered’ correctly, and (b) no further data is retrieved (there should be a second ReloadDashboard saw call, plus four flash charts).
(Fiddler’s copy -> full summary is useful for this, as is the breakpoint feature so you can pause after each response and see how it’s rendered to determine what the content was.)

So, web_text_link is great for navigating but is the case that LR’s replay engine doesn’t honour the ajax sufficiently, and/or I’m misunderstanding the principle of the tool?
Using “URL mode” captures the ajax behaviour, eg:

web_submit_data("saw.dll_13",
		"Action=http://myserver:7777/analytics/saw.dll?ReloadDashboard&_scid={CSRule_1_UID2}",
		"Method=POST",
		"RecContentType=text/html",
		"Referer=http://myserver:7777/analytics/saw.dll?Dashboard&_scid={CSRule_1_UID2}&PortalPath=/shared/Financials/_portal/General%20Ledger&Page=Overview&Action=RefreshAll&ViewState={Siebel_Analytic_ViewState199}&StateAction=samePageState",
		"Snapshot=t96.inf",
		"Mode=HTTP",
		ITEMDATA,
		"Name=InFrameset", "Value=false", ENDITEM,
		"Name=Page", "Value=Overview", ENDITEM,
		"Name=_scid", "Value={CSRule_1_UID2}", ENDITEM,
		"Name=Embed", "Value=true", ENDITEM,
		"Name=PortalPath", "Value=/shared/Financials/_portal/General Ledger", ENDITEM,
		"Name=Caller", "Value=Dashboard", ENDITEM,
		"Name=ViewState", "Value=tvr45qs2u7d1glbfaopqlvvinu", ENDITEM,
		"Name=reloadTargets", "Value=d:dashboard~p:d127730sp2eqcj54~r:ojn7k4k6te44d9ag", ENDITEM,
		"Name=ajaxType", "Value=iframe", ENDITEM,
		LAST);

but as you can see the POSTed data is full of IDs that I assume must correlate with the dashboard HTML.
Given enough time and enough monkeys I’m sure it would be possible to write a LR script that did this – but that would be with the net result of a single dashboard being replayable.

We can get a semblance of load testing on the database server by using web_text_link, but since the data coming back isn’t rendered properly it’s not possible to simulate a real user’s session, only one-off hits of dashboards.

Older Posts »

Blog at WordPress.com.