rmoff

October 10, 2011

Instrumenting OBIEE – the final chapter


This article has been superseded by a newer version: Instrumenting OBIEE Database Connections For Improved Performance Diagnostics


(Previously on this blog: 1, 2, 3)

Summary

Instrument your code.
Stop guessing.
Make your DBA happy.
Make your life as a BI Admin easier.

The Problem

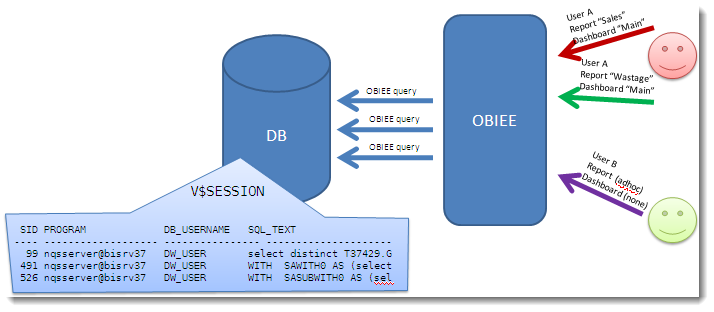
OBIEE will typically connect to the database using a generic application account.
(Hopefully, you’ll have isolated it to an account used only for this purpose – if you haven’t, you should.)

The problem is that you lose a lot of visibility of work both up and down the stack.

  • An OBIEE query is causing a problem on the database – how do you identify the originator?
  • You want to investigate the performance of an OBIEE query, but how do you identify which DB session it is?

We know SID 491 is causing a problem, but how do we identify the originating OBIEE user?

You could start piecing together Usage Tracking and NQQuery.log files, but it’s hardly convenient or instantaneous is it?

The solution

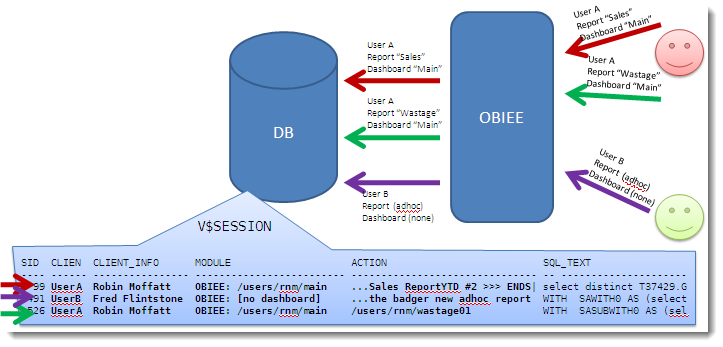
By taking advantage of native Oracle procedures, we can instrument our OBIEE code to pass through lots of valuable information:

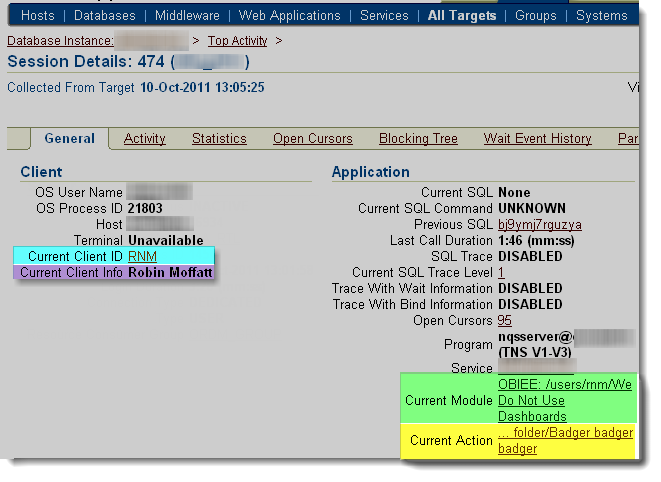
Now we can see which OBIEE user fired the query resulting in SID 491, and not only the user, but the dashboard and request name they are running.

This works in both OBIEE 10g and 11g.

See my previous post here for further background, and discussion of the procedures used.

Implementing it – overview

In essence, we harness internal OBIEE session variables which hold the user ID, name, dashboard and report name. We put a set of database calls on the connection pool(s) associated with query requests.

We have to do a bit of trickery to work around two issues.

Firstly, the variables may not be set (you may not have saved your new request yet, or may be running it outside of a dashboard). To get around this, we create two dummy session variables with the same names, and populate them with dummy init blocks.

Secondly, there is a limitation to the number of characters that can be passed through, and so we manipulate the string if necessary to use the right-most characters.

Implementing it – Init Block and Dummy Variables

Summary:

Create two init block/session variable pairs:

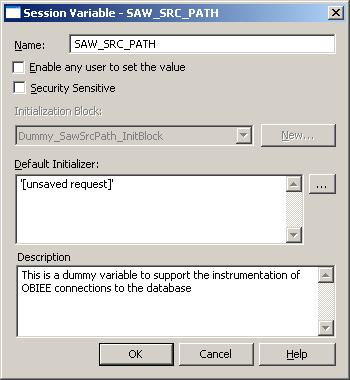
Session Variables

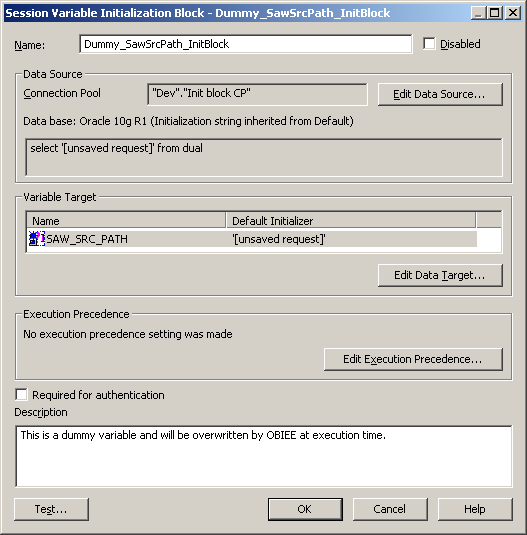
Initialisation Blocks

Be sure to use a connection pool which isn’t used for queries.

Step-by-step

Load up your RPD. If you haven’t already, create a new connection pool that is just for these init blocks. It can be to any database – in the examples below it’s an Oracle one, but any that supports selecting from a dummy table like DUAL in Oracle.

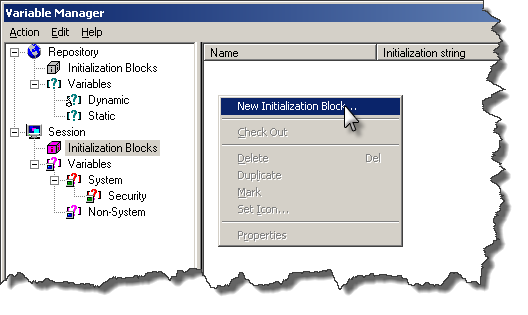
Go to Manage -> Variables, click on Session -> Initialisation Blocks. Right click in the section to the right, and select New Initialization Block.

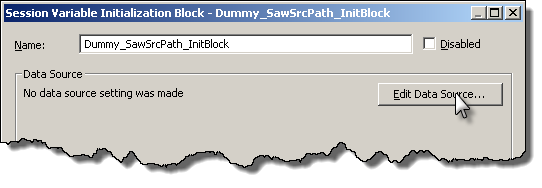
Call the init block Dummy_SawSrcPath_InitBlock, and then click on “Edit Data Source”

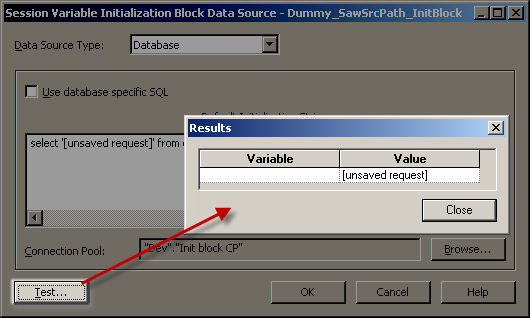
Set the Data Source Type to Database, and the init string to

select '[unsaved request]' from dual

Click on Browse to set the Connection Pool used. The connection pool should be one exclusively for init blocks (not the same you use for queries). If you try to use the same connection pool as for queries, you’ll most likely get an error when you logon.

Once you’ve set the connection pool, click on Test – you should get a result as shown:

If the Test doesn’t succeed then you need to fix the problem before you continue.

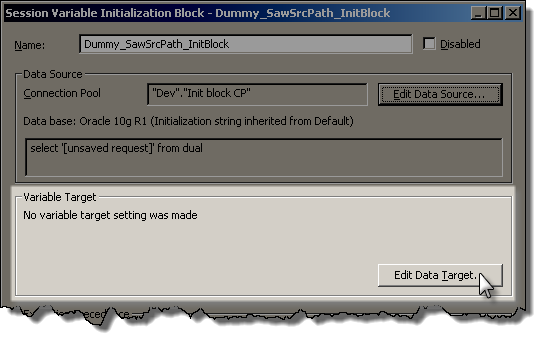
Assuming it’s worked, click OK to return to the Init Block creation window. We now want to define the dummy variable, so to do so click on “Edit Data Target”:

Click on New to create a new variable, and give it the name SAW_SRC_PATH. Make sure you get the name exactly correct, no typos.
Give it a default initializer, and then click OK.

Make sure your init block setup now looks like this:

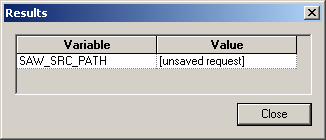
Click on Test, and expect to get this returned:

Assuming it works, then click OK to save the new Init Block and Variable.

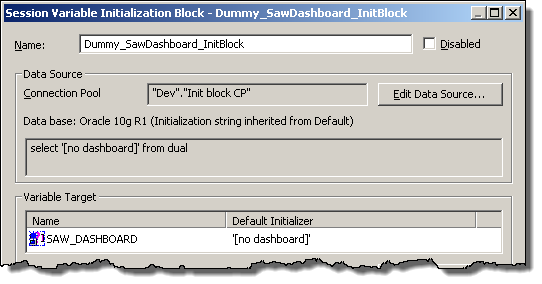
Repeat as above to create an init block/variable pair for SAW_DASHBOARD, looking like this:

When you’ve finished, you should have two init block/variables pairs set up like this:

Session Variables

Initialisation Blocks

Implementing it – connection pool

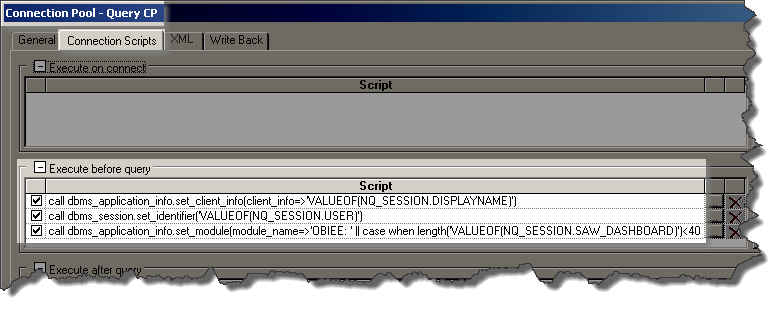
Add these three SQL statements to the “Execute before query” of “Connection Scripts” of each Connection Pool which is used for queries.
Do not add them to ones which are used for init blocks / authentication etc.

call dbms_application_info.set_client_info(client_info=>'VALUEOF(NQ_SESSION.DISPLAYNAME)')
call dbms_session.set_identifier('VALUEOF(NQ_SESSION.USER)')
call dbms_application_info.set_module(module_name=>'OBIEE: ' || case when length('VALUEOF(NQ_SESSION.SAW_DASHBOARD)')<40 then 'VALUEOF(NQ_SESSION.SAW_DASHBOARD)' else '...' || substr('VALUEOF(NQ_SESSION.SAW_DASHBOARD)',-37) end,action_name=>case when length('VALUEOF(NQ_SESSION.SAW_SRC_PATH)')<31 then 'VALUEOF(NQ_SESSION.SAW_SRC_PATH)' else '...' || substr('VALUEOF(NQ_SESSION.SAW_SRC_PATH)',-28) end);

This sets values as follows:

  • Client Identifier is the OBIEE login user id
  • Client Info is the user’s display name.
  • Module and Action are populated with the dashboard name (prefixed by “OBIEE”) and report names respectively, truncated to the left if necessary to fit into the field size.

NB CLIENT_IDENTIFIER and CLIENT_INFO have a larger capacity so could be used if you want to view more of the report/dashboard detail:

V$SESSION column      Max value length
MODULE                47
ACTION                31
CLIENT_INFO           63
CLIENT_IDENTIFIER     63

Reference:
DBMS_APPLICATION_INFO
DBMS_SESSION

Testing the changes

If you’re currently logged into Answers, logout and log back in. This is necessary for the dummy session variables to populate.

Run this sql*plus SQL script below to look at any existing OBIEE queries running on the database.


set linesize 170
col program for a30
col client_info for a20
col client_identifier for a18
col module for a47
col action for a31

SELECT SID,PROGRAM, CLIENT_IDENTIFIER, CLIENT_INFO, MODULE, ACTION FROM V$SESSION WHERE LOWER(PROGRAM) LIKE 'nqsserver%';

Now login to Answers, and run an existing report, or create a new one. When you re-run the SQL script you should see your session now listed:

Not a fan of sql*plus?

If for some strange reason you don’t love sql*plus, you can obviously use the above SQL in any other SQL client. Or, you can fire up Enterprise Manager and see the same set of information:

(run at a different time from the SQL above, so different report and dashboard names)

Warning

It’s occurred to me that by parsing in user-provided values to a string that’s executed on the database, there could be the potential for a breach through SQL Injection via a maliciously named report or dashboard.

I’ve not been able to find a report name which does cause trouble, but I have never tried exploiting SQL injection before.

It is another good reason to make sure that you’re using a DB account solely created for reporting queries from OBIEE, because then its privileges can be greatly restricted. This isn’t an excuse not to test for SQL Injection, but a reminder of why good practices such as granting of least privileges exist.

Troubleshooting

  • Make sure you don’tsuffix the database calls with semi-colons (statement terminators). If you do you’ll probably get an error like this:
    [nQSError: 17001] Oracle Error code: 911, message: ORA-00911: invalid character at OCI call OCIStmtExecute
    
  • If you’re having problems implementing this, or doing further playing around with it, you can see the exact SQL that’s executed on connection by bumping up LOGLEVEL and checking NQQuery.log.
  • Don’t use the same connection pool for the init blocks as you do for queries. If you try this, then the init blocks will fire and try to submit a command on the database which requires the variables that the very init blocks are trying to populate. Confused? OBIEE certainly will be too.
  • If someone creates a report or dashboard with single quote in the name, it causes problems. The error will be ambiguous too:

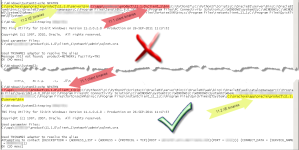
    State: HY000. Code: 10058. [NQODBC

October 5, 2011

OBI 11g : UPGAST-00055: error reading the Oracle Universal Installer inventory

Filed under: Inventory, obiee 11g, oui — rmoff @ 10:56

It’s not my fault really.

When running an installation, presented with the option of

  • (a) do a bunch of stuff and wait to continue the install later or
  • (b) tick a box and continue now

it’s a better man that I who would opt for option (a).

When I recently installed OBIEE 11g, I was prompted to get a script run as root to set up the inventory, or tick “Continue Installation with local inventory” to continue with the install.

Not having root privileges on the machine, not really understanding the purpose of OUI inventory on a single installation machine, and mostly just being a bit lazy, I obviously went for the path of least resistance.

Lazy people click here

The installation proceeded with no further issues, and I spent a couple of happy hours tinkering with the freshly installed OBI 11g and EM.

But… you cross the gods of OUI’s inventory at your peril…

When I tried to run the Upgrade Assistant, got an error:

/app/oracle/product/fmw_home/Oracle_BI1/bin $./ua
Oracle Fusion Middleware Upgrade Assistant 11.1.1.5.0
Log file is located at: /app/oracle/product/fmw_home/Oracle_BI1/upgrade/logs/ua2011-10-05-08-53-26AM.log
UPGAST-00055: error reading the Oracle Universal Installer inventory
The inventory pointer location /etc/oraInst.loc is either not readable or does not exist

Sure enough, the file doesn’t exist:

$ls -l /etc/oraInst.loc
ls: /etc/oraInst.loc: No such file or directory

Fortunately it appears you can make amends with OUI easily, by running as root the script which you were originally asked to run:

[root@server]/ $/app/oracle/product/oraInventory/createCentralInventory.sh
Setting the inventory to /app/oracle/product/oraInventory
Setting the group name to biadmin
Creating the Oracle inventory pointer file (/etc/oraInst.loc)
Changing permissions of /app/oracle/product/oraInventory to 770.
Changing groupname of /app/oracle/product/oraInventory to biadmin.
The execution of the script is complete

This creates /etc/oraInst.loc, which simply points to the original local inventory which was created:

$cat /etc/oraInst.loc
inventory_loc=/app/oracle/product/oraInventory
inst_group=biadmin

After this the Upgrade Assistant fired up just fine.

September 26, 2011

Oracle – tnsping – Message 3513 not found; product=NETWORK; facility=TNS

Filed under: windows, XE 11gR2 — rmoff @ 11:38

Short note to record this, as Google drew no hits on it.

Windows XP machine with existing Oracle 11.1 client installation, all working fine.

Installed Oracle 11.2 XE, and started getting these errors:

C:\Windows\System32>tnsping DBNAME

TNS Ping Utility for 32-bit Windows: Version 11.2.0.2.0 - Production on 26-SEP-2011 11:01:11

Copyright (c) 1997, 2010, Oracle.  All rights reserved.

Used parameter files:
C:\app\userid\product\11.1.0\client_1\network\admin\sqlnet.ora


Used TNSNAMES adapter to resolve the alias
Message 3513 not found;  product=NETWORK; facility=TNS
OK (20 msec)

Also got these errors from a previously-functioning ODBC query in Excel when I tried to refresh it:

  • [Microsoft][ODBC driver for Oracle][Oracle]
  • [Microsoft][ODBC Driver Manager] Driver’s SQLSetConnectAttr failed

Google drew a blank on “Message 3513 not found”, but with a bit of guidance from Ed Stevens’ and Charles Hooper’s blogs I checked my PATH variable and found this:

C:\Windows\System32>set
[...]
ORACLE_HOME=C:\app\userid\product\11.1.0\client_1\
[...]
Path=C:\oraclexe\app\oracle\product\11.2.0\server\bin;C:\app\userid\product\11.1.0\client_1\bin;C:\Python27\;C:\Python27\Scripts;C:\OracleBI\server\Bin;C:\OracleBI\web\bin;C:\OracleBI\web\catalogmanager;C:\Program Files\Java\jdk1.6.0_26\bin;C:\WINDOWS\system32;C:\WINDOWS;C:\WINDOWS\System32\Wbem;[...]
[...]
TNS_ADMIN=C:\app\userid\product\11.1.0\client_1\network\admin
[...]

PATH is evaluated in order, left to right. Note that the 11.2 XE binaries are now listed before the 11.1 client binaries.

So whilst the TNS_NAMES and ORACLE_HOME are still for the 11.1 client, it looks like I’m invoking the 11.2 binaries for tnsping and presumably ODBC driver too.

How to fix

Moving the path of 11.2 XE bin to the end of the PATH variable fixed the problem. Presumably also removing the 11.2 XE path would have worked.

I don’t know if there are going to be other ramifications of changing this path variable around (presumably XE would start hitting 11.1 binaries??), but it fixed my immediate problem both with TNSPing and the ODBC queries.

Screenshot

September 13, 2011

DBMS_STATS – GATHER AUTO

Filed under: dbms_stats, oracle — rmoff @ 17:28

In Oracle 11g, the DBMS_STATS procedure GATHER_SCHEMA_STATS takes a parameter ‘options’ which defines the scope of the objects processed by the procedure call, as well as the action. It can be either GATHER or LIST (gather the stats, or list out the objects to be touched, respectively), and AUTO, STALE or EMPTY (defining the object selection to process).

  • GATHER on its own will gather stats on all objects in the schema
  • GATHER EMPTY / LIST EMPTY is self-explanatory – objects with no statistics.
  • GATHER STALE / LIST STALE is pretty obvious too – objects that have stale statistics (i.e. have had 10% change to them since statistics were last gathered). NB this 10% can be changed at an object/schema/DB level.
  • However, the documentation is ambiguous as to the precise function of GATHER AUTO / LIST AUTO.

There’s even a MOS note, “Differences between GATHER STALE and GATHER AUTO (Doc ID 228186.1)”, which strangely enough – given the precision of its title – doesn’t really explain the difference.

I’m quite fastidious about these things, particular in the documentation which I believe ought to be beyond fault. The frustrating thing for me is the sprinkling of fairy dust approach to describing the parameter:

  • “Oracle implicitly determines which objects” — ok, but how does it “implicitly determine”, what algorithm sits behind it?
  • “Oracle[…]determines how to gather” — does it intelligently determine how to gather the stats for each object’s characteristics, or does it passively fallback to the defaults? There’s a difference, since one is a good starting point and the other would be in theory an ideal.

Why does this matter? Because statistics matter so much, and so a stats gathering strategy that is accurate and efficient is important. We can only do this if we understand exactly what the product is doing. GIGO, and all that.

Reading, and re-reading, the documentation, I think the explanation is this:

  • GATHER AUTO gathers stats on objects with stats which are either STALE or EMPTY, i.e. the combined object list of
    • GATHER STALE
    • GATHER EMPTY
  • GATHER AUTO automagically defines all the other parameters relating to how the statistics are gathered – method_opt, estimate_percent, etc. User-specified values for these parameters are just ignored.

I’ve raised an SR to try and get proper clarification, and will update here if/when I find out.

UPDATE Oracle confirmed in an SR that “Gather AUTO Processes stale objects + objects without statistics (empty)”

Note Doc ID 1073120.1 which details method_opt that will be used in GATHER AUTO.

Finally, don’t forget that representative statistics != non-stale statistics. None other than Ask Tom points this out.

Just because statistics are not “stale”, doesn’t mean that are representative of your data. You should always understand your data and make sure you’re giving the CBO the most accurate information you can about the data.

August 8, 2011

Have you defined CLIENT_ID in OBIEE yet?

Filed under: obiee, oracle — rmoff @ 07:34

Have you defined CLIENT_ID in your OBIEE RPD yet?
You really ought to.

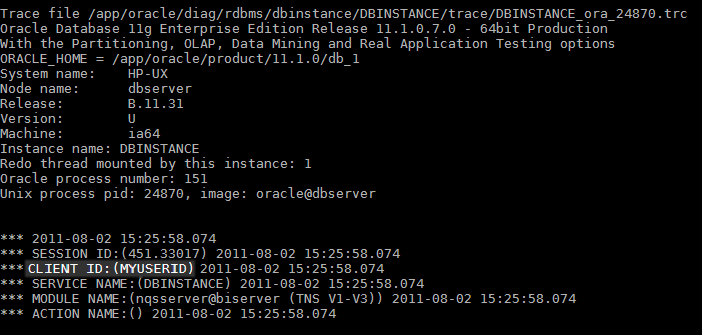
As well as helping track down users of troublesome queries, it also tags dump files with the OBIEE user of an offending query should the worst occur:

And the culprit is ...

For details, see:

June 28, 2011

Oracle 11g – How to force a sql_id to use a plan_hash_value using SQL Baselines

Filed under: etl, oracle, performance, plan management, sql plan baseline — rmoff @ 14:13

Here’s a scenario that’ll be depressingly familiar to most reading this: after ages of running fine, and no changes to the code, a query suddenly starts running for magnitudes longer than it used to.

In this instance it was an ETL step which used to take c.1 hour, and was now at 5 hours and counting. Since it still hadn’t finished, and the gods had conspired to bring down Grid too (unrelated), I generated a SQL Monitor report to see what was happening:

select DBMS_SQLTUNE.REPORT_SQL_MONITOR(
   type=>'HTML',
   report_level=>'ALL',sql_id=>'939abmqmvcc4d') as report
FROM dual;

(h/t to Martin Berger for this)

It showed a horrendous explain plan:

A very naughty plan

Using Kerry Osborne’s script to look at the plan_hash_value over time from AWR, it was clear that the CBO had picked a new, bad, explain plan.

So we knew the sql_id, and we knew the plan_hash_value of the plan which we wanted the CBO to use. But how to do this?

Back to Kerry Osborne again, and his article about SQL Plan Baselines. He (and others) write in detail about how and what SQL Plan Baselines are, but in essence it lets you tell Oracle which plan to use (or optionally, prefer) for a given sql_id.

Since the desired plan_hash_value was no longer in the cursor cache, we could get it back from AWR, loaded in via a SQL Tuning Set. Here’s the code with in-line comments explaining the function of each block:

/* 
Set up a SQL Baseline using known-good plan, sourced from AWR snapshots
https://rnm1978.wordpress.com/

In this example, sql_id is 939abmqmvcc4d and the plan_hash_value of the good plan that we want to force is 1239572551
*/

-- Drop SQL Tuning Set (STS)
BEGIN
  DBMS_SQLTUNE.DROP_SQLSET(
    sqlset_name => 'MySTS01');
END;

-- Create SQL Tuning Set (STS)
BEGIN
  DBMS_SQLTUNE.CREATE_SQLSET(
    sqlset_name => 'MySTS01',
    description => 'SQL Tuning Set for loading plan into SQL Plan Baseline');
END;

-- Populate STS from AWR, using a time duration when the desired plan was used
--  List out snapshot times using :   SELECT SNAP_ID, BEGIN_INTERVAL_TIME, END_INTERVAL_TIME FROM dba_hist_snapshot ORDER BY END_INTERVAL_TIME DESC;
--  Specify the sql_id in the basic_filter (other predicates are available, see documentation)
DECLARE
  cur sys_refcursor;
BEGIN
  OPEN cur FOR
    SELECT VALUE(P)
    FROM TABLE(
       dbms_sqltune.select_workload_repository(begin_snap=>22673, end_snap=>22710,basic_filter=>'sql_id = ''939abmqmvcc4d''',attribute_list=>'ALL')
              ) p;
     DBMS_SQLTUNE.LOAD_SQLSET( sqlset_name=> 'MySTS01', populate_cursor=>cur);
  CLOSE cur;
END;
/

-- List out SQL Tuning Set contents to check we got what we wanted
SELECT 
  first_load_time          ,
  executions as execs              ,
  parsing_schema_name      ,
  elapsed_time  / 1000000 as elapsed_time_secs  ,
  cpu_time / 1000000 as cpu_time_secs           ,
  buffer_gets              ,
  disk_reads               ,
  direct_writes            ,
  rows_processed           ,
  fetches                  ,
  optimizer_cost           ,
  sql_plan                ,
  plan_hash_value          ,
  sql_id                   ,
  sql_text
   FROM TABLE(DBMS_SQLTUNE.SELECT_SQLSET(sqlset_name => 'MySTS01')
             );

-- List out the Baselines to see what's there
SELECT * FROM dba_sql_plan_baselines ;

-- Load desired plan from STS as SQL Plan Baseline
-- Filter explicitly for the plan_hash_value here if you want
DECLARE
my_plans pls_integer;
BEGIN
  my_plans := DBMS_SPM.LOAD_PLANS_FROM_SQLSET(
    sqlset_name => 'MySTS01', 
    basic_filter=>'plan_hash_value = ''1239572551'''
    );
END;
/

-- List out the Baselines
SELECT * FROM dba_sql_plan_baselines ;

Now when the query’s run, it will use the desired plan.

Things to note:

  • In 10g and 11gR1 the default for SELECT_WORKLOAD_REPOSITORY is to return only BASIC information, which excludes the plan! So DBMS_SPM.LOAD_PLANS_FROM_SQLSET doesn’t load any plans.
    • It doesn’t throw a warning either, which it could sensibly, since the STS has no plan, and it can see that</grumble>
    • This changes to TYPICAL in 11gR2 (thanks Surachart!)
  • Parameter “optimizer_use_sql_plan_baselines” must be set to TRUE for a baseline to be used
  • Flush the cursor cache after loading the baseline to make sure it gets picked up on next execution of the sql_id

References:

Thanks to John Hallas for his help with this problem.

June 15, 2011

Global statistics high/low values when using DBMS_STATS.COPY_TABLE_STATS

Filed under: copy_table_stats, dbms_stats, DWH, oracle, Statistics — rmoff @ 08:16

There is a well-documented problem relating to DBMS_STATS.COPY_TABLE_STATS between partitions where high/low values of the partitioning key column were just copied verbatim from the source partition. This particular problem has now been patched (see 8318020.8). For background, see Doug Burns’ blog and his excellent paper which covers the whole topic of statistics on partitioned tables.

This post Maintaining statistics on large partitioned tables on the Oracle Optimizer blog details what the dbms_stats.copy_table_stats does with regards to the high/low values:

It adjusts the minimum and maximum values of the partitioning column as follows; it uses the high bound partitioning value as the maximum value of the first partitioning column (it is possible to have concatenated partition columns) and high bound partitioning value of the previous partition as the minimum value of the first partitioning column for range partitioned table

However, two problems as I see them remain:

  1. Table global stats don’t update high_value for partitioning key
  2. high_value of one partition overlaps with low_value of the next.
    • Partition high-bound values are defined as LESS THAN, not LESS THAN OR EQUAL TO – therefore the maximum possible value of the column is less than this, not equal to it.
    • The minimum value of the partitioning column is correct using this method (although be aware of 10233186 if you use a MAXVALUE in your range partitioning).

Here’s a script that demonstrates the two issues, written and commented based on execution on 11.1.0.7:

/* copy_stats_1.sql

Illustrate apparent problem with high_val on partition statistics when using partition to partition statistics copy
  * Table global stats do not update high_value for partitioning key
  * high_value of one partition overlaps with low_value of the next.

Requires display_raw function by Greg Rahn, see here: http://tinyurl.com/display-raw

https://rnm1978.wordpress.com/

*/

set echo off
set timing off
set feedback off
set linesize 156
set pagesize 57
col owner for a10
col table_name for a30
col column_name for a30
col partition_name for a20
col low_val for a10
col high_val for a10
col num_rows for 999,999,999,999
col "sum of num_rows" for 999,999,999,999
break on stats_update_time skip 1 duplicates

clear screen

prompt ===== This script uses the DISPLAY_RAW function =======
prompt
prompt Available here: http://structureddata.org/2007/10/16/how-to-display-high_valuelow_value-columns-from-user_tab_col_statistics/
prompt
prompt ========================================================
prompt
prompt
prompt
prompt =-=-=-=-=-=-=-=-=-=-=-=-=-=-=-=-=-=-=-=-=-=-=-=-=-=-=-=-=-=-=-=-=-=
prompt 1. Set up an partitioned table with data and examine the statistics
prompt
prompt
set echo on
pause
-- Create fact table
drop table BASE_DATA;
CREATE table BASE_DATA ( day_key integer, store_key INTEGER,  item_key  INTEGER, fact_001 NUMBER(15,0), fact_002 NUMBER(15,0), fact_003 NUMBER(18,2))
 PARTITION BY RANGE (DAY_KEY)
  SUBPARTITION BY HASH (store_key)
  SUBPARTITION TEMPLATE ( SUBPARTITION "SP1" , SUBPARTITION "SP2" , SUBPARTITION "SP3" , SUBPARTITION "SP4")
 ( PARTITION "PART_20110401"  VALUES LESS THAN (20110402))
 PARALLEL;

pause
-- Create indexes
CREATE UNIQUE INDEX BASE_DATA_PK ON BASE_DATA ("DAY_KEY", "STORE_KEY", "ITEM_KEY") LOCAL parallel;
create bitmap index base_data_ix2 on base_data (store_key) local parallel;
create bitmap index base_data_ix3 on base_data (item_key) local parallel;

pause 

-- Populate fact table
exec DBMS_RANDOM.SEED('StraussCookPieterson');
insert into BASE_DATA values (20110401,101,2000, dbms_random.value(0,999) , dbms_random.value(0,999) , dbms_random.value(0,999) );
insert into BASE_DATA values (20110401,102,2000, dbms_random.value(0,999) , dbms_random.value(0,999) , dbms_random.value(0,999) );
commit;

pause 

-- Gather full stats on table
set feedback on
exec dbms_stats.gather_table_stats(     ownname=>USER, tabname=>'BASE_DATA', granularity=>'AUTO');
set feedback off

pause 

select * from base_data order by day_key;
pause
-- Examine statistics

set echo off
prompt
prompt DBA_PART_TABLES
select partitioning_type, subpartitioning_type, partition_count from dba_part_tables where table_name='BASE_DATA' and owner=USER;

prompt
prompt DBA_TAB_STATS_HISTORY
SELECT table_name, partition_name, stats_update_time
FROM   dba_tab_stats_history
WHERE  owner = USER
AND table_name = 'BASE_DATA'
ORDER  BY stats_update_time asc;
pause

prompt
prompt  DBA_TAB_STATISTICS (table level only):
prompt  **************************************
select table_name,num_rows,
to_char(LAST_ANALYZED,'YYYY-MM-DD-HH24:MI:SS') "LAST_ANALYZED"
from DBA_TAB_STATISTICS
where table_name='BASE_DATA' and owner=USER
and partition_name is null
;

pause 

compute sum of num_rows on report
prompt
prompt DBA_TAB_STATISTICS (Partition level):
prompt *************************************
select table_name,partition_name,num_rows,
to_char(LAST_ANALYZED,'YYYY-MM-DD-HH24:MI:SS') "LAST_ANALYZED"
from DBA_TAB_STATISTICS
where table_name='BASE_DATA' and owner=USER
and partition_name is not null
and subpartition_name is null
order by table_name,partition_name
;
clear computes

pause 

prompt DBA_PART_COL_STATISTICS:
prompt ************************
select a.partition_name,a.column_name,to_char(a.LAST_ANALYZED,'YYYY-MM-DD-HH24:MI:SS') "LAST_ANALYZED",
display_raw(a.low_value,b.data_type) as low_val,display_raw(a.high_value,b.data_type) as high_val
from DBA_PART_COL_STATISTICS a
inner join dba_tab_cols b on a.table_name=b.table_name and a.column_name=b.column_name and a.owner=b.owner
where a.table_name='BASE_DATA' and a.owner=USER and a.partition_name is not null
and a.column_name = 'DAY_KEY'
;

prompt
prompt Observe: Partition high/low values for DAY_KEY - currently 1st April
pause 

prompt
prompt DBA_TAB_COL_STATISTICS:
prompt ***********************
select a.column_name,to_char(a.LAST_ANALYZED,'YYYY-MM-DD-HH24:MI:SS') "LAST_ANALYZED",
display_raw(a.low_value,b.data_type) as low_val,display_raw(a.high_value,b.data_type) as high_val
from DBA_TAB_COL_STATISTICS a inner join dba_tab_cols b on a.table_name=b.table_name and a.column_name=b.column_name and a.owner=b.owner
where a.table_name='BASE_DATA' and a.owner=USER and a.column_name = 'DAY_KEY'
;
prompt
prompt Observe: Table high/low values for DAY_KEY - currently 1st April
pause 

prompt
prompt
prompt
prompt =-=-=-=-=-=-=-=-=-=-=-=-=-=-=-=-=-=-=-=-=-=-=-=-=-=-=-=-=-=-=-=-=-=
prompt 2. Create new partition and use dbms_stats.copy_table_stats to set the stats for it. Leave data in the table unchanged.
prompt
prompt
pause

set feedback on
set echo on
alter table base_data add PARTITION "PART_20110402"  VALUES LESS THAN (20110403);
exec dbms_stats.copy_table_stats(ownname=>USER, tabname=>'BASE_DATA',SRCPARTNAME=>'PART_20110401',DSTPARTNAME=>'PART_20110402');
pause
set feedback off

select * from base_data order by day_key;
pause
-- Examine statistics

set echo off
prompt
prompt DBA_PART_TABLES
select partitioning_type, subpartitioning_type, partition_count from dba_part_tables where table_name='BASE_DATA' and owner=USER;

prompt
prompt DBA_TAB_STATS_HISTORY
SELECT table_name, partition_name, stats_update_time
FROM   dba_tab_stats_history
WHERE  owner = USER
AND table_name = 'BASE_DATA'
ORDER  BY stats_update_time asc;
pause

prompt  DBA_TAB_STATISTICS (table level only):
prompt  **************************************
select table_name,num_rows,
to_char(LAST_ANALYZED,'YYYY-MM-DD-HH24:MI:SS') "LAST_ANALYZED"
from DBA_TAB_STATISTICS
where table_name='BASE_DATA' and owner=USER
and partition_name is null
;

compute sum of num_rows on report
prompt
prompt DBA_TAB_STATISTICS (Partition level):
prompt *************************************
select table_name,partition_name,num_rows,
to_char(LAST_ANALYZED,'YYYY-MM-DD-HH24:MI:SS') "LAST_ANALYZED"
from DBA_TAB_STATISTICS
where table_name='BASE_DATA' and owner=USER
and partition_name is not null
and subpartition_name is null
order by table_name,partition_name
;
clear computes

prompt
prompt Side note: Oracle doesn't aggregate the partition num_rows statistic up to global when doing a copy stats, 
prompt            so whilst the sum of partition num_rows is four, the global num_rows is still two.
prompt            Of course, at this point, there are only actually two rows of data in the table.
prompt   
prompt (also, observe that LAST_ANALYZED for the new partition is that of the partition from where the stats were copied, and isn't
prompt  the same as STATS_UPDATE_TIME for the partition on DBA_TAB_STATS_HISTORY - which makes sense when you think about it)
pause

prompt
prompt DBA_TAB_PARTITIONS:
prompt ********************
select partition_name, high_value from dba_tab_partitions where table_name='BASE_DATA' and table_owner=USER;
prompt
prompt DBA_PART_COL_STATISTICS:
prompt ************************
select a.partition_name,a.column_name,to_char(a.LAST_ANALYZED,'YYYY-MM-DD-HH24:MI:SS') "LAST_ANALYZED",
display_raw(a.low_value,b.data_type) as low_val,display_raw(a.high_value,b.data_type) as high_val
from DBA_PART_COL_STATISTICS a
inner join dba_tab_cols b on a.table_name=b.table_name and a.column_name=b.column_name and a.owner=b.owner
where a.table_name='BASE_DATA' and a.owner=USER and a.partition_name is not null
and a.column_name = 'DAY_KEY'
;
prompt
prompt See the Partition high/low values for DAY_KEY in the new partition (PART_20110402) into which we copied the stats:
prompt --> low_value is correct
prompt --> high_value is out of range for possible data in that partition
prompt -----> high_value of the partition is < 20110403, ** not **  <= 20110403
prompt
pause
prompt
prompt DBA_TAB_COL_STATISTICS:
prompt ***********************
select a.column_name,to_char(a.LAST_ANALYZED,'YYYY-MM-DD-HH24:MI:SS') "LAST_ANALYZED",
display_raw(a.low_value,b.data_type) as low_val,display_raw(a.high_value,b.data_type) as high_val
from DBA_TAB_COL_STATISTICS a inner join dba_tab_cols b on a.table_name=b.table_name and a.column_name=b.column_name and a.owner=b.owner
where a.table_name='BASE_DATA' and a.owner=USER and a.column_name = 'DAY_KEY'
;
prompt
prompt See the Table high/low values for DAY_KEY - currently 1st April, even though the stats on individual partitions has a (wrong) high_val of 3rd April.
pause 
prompt
prompt
prompt
prompt =-=-=-=-=-=-=-=-=-=-=-=-=-=-=-=-=-=-=-=-=-=-=-=-=-=-=-=-=-=-=-=-=-=
prompt 3. Add another new partition and use dbms_stats.copy_table_stats to set the stats for it. Leave data in the table unchanged.
prompt
prompt
pause

set feedback on
set echo on
alter table base_data add PARTITION "PART_20110403"  VALUES LESS THAN (20110404);
exec dbms_stats.copy_table_stats(ownname=>USER, tabname=>'BASE_DATA',SRCPARTNAME=>'PART_20110401',DSTPARTNAME=>'PART_20110403');
pause
set feedback off

select * from base_data order by day_key;
pause
-- Examine statistics

set echo off
prompt
prompt DBA_PART_TABLES
select partitioning_type, subpartitioning_type, partition_count from dba_part_tables where table_name='BASE_DATA' and owner=USER;

prompt
prompt DBA_TAB_STATS_HISTORY
SELECT table_name, partition_name, stats_update_time
FROM   dba_tab_stats_history
WHERE  owner = USER
AND table_name = 'BASE_DATA'
ORDER  BY stats_update_time asc;
pause

prompt  DBA_TAB_STATISTICS (table level only):
prompt  **************************************
select table_name,num_rows,
to_char(LAST_ANALYZED,'YYYY-MM-DD-HH24:MI:SS') "LAST_ANALYZED"
from DBA_TAB_STATISTICS
where table_name='BASE_DATA' and owner=USER
and partition_name is null
;

compute sum of num_rows on report
prompt
prompt DBA_TAB_STATISTICS (Partition level):
prompt *************************************
select table_name,partition_name,num_rows,
to_char(LAST_ANALYZED,'YYYY-MM-DD-HH24:MI:SS') "LAST_ANALYZED"
from DBA_TAB_STATISTICS
where table_name='BASE_DATA' and owner=USER
and partition_name is not null
and subpartition_name is null
order by table_name,partition_name
;
clear computes

pause

prompt
prompt DBA_TAB_PARTITIONS:
prompt ********************
select partition_name, high_value from dba_tab_partitions where table_name='BASE_DATA' and table_owner=USER;
prompt
prompt DBA_PART_COL_STATISTICS:
prompt ************************
select a.partition_name,a.column_name,to_char(a.LAST_ANALYZED,'YYYY-MM-DD-HH24:MI:SS') "LAST_ANALYZED",
display_raw(a.low_value,b.data_type) as low_val,display_raw(a.high_value,b.data_type) as high_val
from DBA_PART_COL_STATISTICS a
inner join dba_tab_cols b on a.table_name=b.table_name and a.column_name=b.column_name and a.owner=b.owner
where a.table_name='BASE_DATA' and a.owner=USER and a.partition_name is not null
and a.column_name = 'DAY_KEY'
;
prompt
prompt You can see that the high_value for the new partition is again too high for the possible values the partition could contain
prompt
prompt But this time we can also see the overlapping high_value of previous column with low_value of the next.
prompt   PART_20110401 has real stats 
prompt   PART_20110402 has copied stats, with a (wrong) high_value of 20110403
prompt   PART_20110403 has copied stats, with a low_value of 20110403 - which is the same as the high_value of the previous partition

prompt
pause
prompt
prompt DBA_TAB_COL_STATISTICS:
prompt ***********************
select a.column_name,to_char(a.LAST_ANALYZED,'YYYY-MM-DD-HH24:MI:SS') "LAST_ANALYZED",
display_raw(a.low_value,b.data_type) as low_val,display_raw(a.high_value,b.data_type) as high_val
from DBA_TAB_COL_STATISTICS a inner join dba_tab_cols b on a.table_name=b.table_name and a.column_name=b.column_name and a.owner=b.owner
where a.table_name='BASE_DATA' and a.owner=USER and a.column_name = 'DAY_KEY'
;
prompt
prompt Table high/low values for DAY_KEY - still 1st April, even though the stats on individual partitions has a (wrong) high_val of 4th April.
pause 

prompt
prompt
prompt
prompt =-=-=-=-=-=-=-=-=-=-=-=-=-=-=-=-=-=-=-=-=-=-=-=-=-=-=-=-=-=-=-=-=-=
prompt 4. Add data to the table, gather real statistics, examine them.
prompt
prompt
pause

set echo on
-- Populate fact table
insert into BASE_DATA values (20110402,101,2000, dbms_random.value(0,999) , dbms_random.value(0,999) , dbms_random.value(0,999) );
insert into BASE_DATA values (20110403,101,2000, dbms_random.value(0,999) , dbms_random.value(0,999) , dbms_random.value(0,999) );
commit;

pause 

-- gather full stats
exec dbms_stats.gather_table_stats(     ownname=>USER, tabname=>'BASE_DATA', granularity=>'AUTO');
pause

select * from base_data order by day_key;
pause
-- Examine statistics

set echo off
prompt
prompt DBA_PART_TABLES
select partitioning_type, subpartitioning_type, partition_count from dba_part_tables where table_name='BASE_DATA' and owner=USER;

prompt
prompt DBA_TAB_STATS_HISTORY
SELECT table_name, partition_name, stats_update_time
FROM   dba_tab_stats_history
WHERE  owner = USER
AND table_name = 'BASE_DATA'
ORDER  BY stats_update_time asc;
pause

prompt  DBA_TAB_STATISTICS (table level only):
prompt  **************************************
select table_name,num_rows,
to_char(LAST_ANALYZED,'YYYY-MM-DD-HH24:MI:SS') "LAST_ANALYZED"
from DBA_TAB_STATISTICS
where table_name='BASE_DATA' and owner=USER
and partition_name is null
;
pause

compute sum of num_rows on report
prompt
prompt DBA_TAB_STATISTICS (Partition level):
prompt *************************************
select table_name,partition_name,num_rows,
to_char(LAST_ANALYZED,'YYYY-MM-DD-HH24:MI:SS') "LAST_ANALYZED"
from DBA_TAB_STATISTICS
where table_name='BASE_DATA' and owner=USER
and partition_name is not null
and subpartition_name is null
order by table_name,partition_name
;
clear computes
prompt
prompt Table num_rows is now accurate
pause 

prompt
prompt DBA_TAB_PARTITIONS:
prompt ********************
select partition_name, high_value from dba_tab_partitions where table_name='BASE_DATA' and table_owner=USER;
prompt
prompt DBA_PART_COL_STATISTICS:
prompt ************************
select a.partition_name,a.column_name,to_char(a.LAST_ANALYZED,'YYYY-MM-DD-HH24:MI:SS') "LAST_ANALYZED",
display_raw(a.low_value,b.data_type) as low_val,display_raw(a.high_value,b.data_type) as high_val
from DBA_PART_COL_STATISTICS a
inner join dba_tab_cols b on a.table_name=b.table_name and a.column_name=b.column_name and a.owner=b.owner
where a.table_name='BASE_DATA' and a.owner=USER and a.partition_name is not null
and a.column_name = 'DAY_KEY'
;

prompt
prompt Partition high/low values for DAY_KEY in each partition is correct
pause

prompt
prompt DBA_TAB_COL_STATISTICS:
prompt ***********************
select a.column_name,to_char(a.LAST_ANALYZED,'YYYY-MM-DD-HH24:MI:SS') "LAST_ANALYZED",
display_raw(a.low_value,b.data_type) as low_val,display_raw(a.high_value,b.data_type) as high_val
from DBA_TAB_COL_STATISTICS a inner join dba_tab_cols b on a.table_name=b.table_name and a.column_name=b.column_name and a.owner=b.owner
where a.table_name='BASE_DATA' and a.owner=USER and a.column_name = 'DAY_KEY'
;
prompt
prompt Table high/low values for DAY_KEY are now correct
pause 

/* #EOF */

From everything that I’ve read, representative stats are essential for Oracle to generate the most efficient explain plan to give the most optimal performance. Out of range problems caused by inaccurate statistics is something frequently referenced. However I’m out of my depth here to determine whether that’s true for the global statistics of this partitioning column not getting updated.

Copying stats have never been intended as a replacement for real stats, that much is clear and frequently stated. They should be part of a carefully designed stats gathering method, based on your applications data and frequency of loading. Hopefully the above, along with the other articles about copy stats out there, will add to the understanding of the functionality and importantly, its limitations. Copying the stats will just buy you time in a critical load schedule, postponing the point at which you do a proper gather. All copy stats is doing is making the statistics a bit more representative of the data – it’s not a proper sample of the data so the quality of the stats will never be as good as if you do a proper gather. When you do the real gather should be whichever comes first of:

  • the point at which you have time in your batch schedule
    or,
  • the stats are too unrepresentative of your data for the Oracle optimizer to generate a sufficiently efficient explain plan in order for your queries to run in the time which the users require.

Maria Colgan from Oracle has kindly reviewed my script and findings, and commented:

Your argument that copy stats sets the high_value wrongly (to high), is correct. We do over estimate the high value by setting it to the partition definition. As you correctly point out no value in the partition will have reach that high_value because a range partition is always specified as less than. We did this so that we can ensure there will be no greater value than this in the partition, otherwise we would have to guess what the max value is.

Maria also pointed out that with regards to the overlapping high/low values

However, this is not the expected behavior. The goal of copy_stats is to provide a temporary fix to the out of range problem by providing a representative set of statistics for a new partition. It is not supposed to be a replacement for statistics gathering.


Reading:

Watch out for these other bugs that I came across reference to:

  • 10234419 Extend dbms_stats.copy_table_stats to all range partitioning key columns
  • Doc ID 1292269.1ORA-01422 While running dbms_stats.copy_table_stats
    • ” This issue would occur when there are more than one schema with same table name.”

Many thanks to Maria Colgan and Doug Burns for reviewing this post and providing useful feedback.
May 26, 2011

Data Warehousing and Statistics in Oracle 11g – Automatic Optimizer Statistics Collection

Filed under: dbms_stats, DWH, oracle, Statistics — rmoff @ 13:35

Chucking a stick in the spokes of your carefully-tested ETL/BI …

My opinion is that automated stats gathering for non-system objects should be disabled on Oracle Data Warehouses across all environments.

All it does it cover up poor design or implementation which has omitted to consider statistics management. Once you get into the realms of millions or billions of rows of data, the automated housekeeping may well not have time to stat all of your tables on each run. And then it becomes a quasi-lottery when your tables will get processed. Or what if you’re working with intra-day loads (eg. near real-time) – the housekeeping job only runs once a day by default.

Even if you have a suitable window and are happy that the job gathers all that it needs to all of the time, what if you want to run your batch at the same time as the task window defined? If you want to run your batch highly parallel (and why wouldn’t you?) then will the stats gather suffer? or affect your batch by running stats highly parallel too?

Suppose you are relying on the auto stats job, and don’t want to run it at the same time as your batch, so you come up with a suitable schedule for them to run at different times. What happens when your DW grows and you need to add a new batch process, and so have to move the window again? How do you know that moving it won’t affect the previous batch’s stats?

If you’re building on an existing system and want to test the performance of your new batch, how are you going to simulate the behaviour of your auto stats job? Even if you trigger it manually, are you going to accurately simulate the statistics that it may or may not need to gather each night? How do you factor in the magical 10% staleness to trigger a stats gather? That is one serious test rig if you want to reproduce all of that.

If you have stats management in place, then turning the auto stats off (for non-system objects) won’t hurt. And if you’re not, then the auto stats job will cover this up in your environments all the way from Dev through to Prod. The first time someone will ask about stats management is when you’re scratching your head over a report or ETL stage “that used to work fine”. And then the horrible truth will dawn that you screwed up, and should have built it into your design from the beginning.

As we say around here, if you want a job done properly, do it tha’ sen. Or rather, as Greg Rahn more articulately says:

I tend to advise people that for a DW the stats gathering should be part of the data flow (ETL/ELT) process and to disable the default job
[…]
If you wish to collect your statistics manually, then you should change the value of AUTOSTATS_TARGET to ORACLE instead of AUTO (DBMS_STATS.SET_PARAM(‘AUTOSTATS_TARGET’,’ORACLE’)). This will keep the dictionary stats up to date and allow you to manually gather stats on your schemas

Julian Dyke says something supporting this view too in his presentation here:

In complex databases do not rely on Auto job
– Unpredictable collection behaviour / duration
– Unpredictable execution plan changes

If you can’t disable the autostats job for whatever reason (maybe another application on the same DB would require changes to accommodate it), then you can shield yourself from its nefarious influences by using LOCK_SCHEMA_STATS to lock the stats on your schema(s). When you manually maintain the stats yourself, you either unlock them first, or use the FORCE option of the stats procedures.

Stabilisers on a high-performance motorbike

It’s easy enough to understand why Oracle built the Automated Stats job, and why it’s enabled by default. In an effort to move towards the Self Managing Database, it makes sense to automate whatever you can, so that the scope for poor performance is reduced. Abstracting things slightly, the optimizer is just part of the DB code, and stats reason for being is to support the optimizer, so why not keep it under the covers where possible?
The trouble with this is that it might be fine for the middle of the road. The bog standard, quick-win, fire it and run project doing nicely standard OLTP work. One fewer thing for the developer to worry about. It’s probably quite good for lots of things. But Oracle RDBMS is a big beast, and an expensive bit of kit. Do you really want to meander along in the slow lane all the time, content to be using a one-size-fits-all approach?
Kawasaki motorbike with stabilisers

If you’re serious about exploiting the power of Oracle for your data warehouse, then you need to understand what needs to be done to get it to perform. One of the big factors is accurate, representative statistics. And to get these you have to take the stabilisers off and learn how to do it properly yourself, because you’re the one that understands your data. Data loads are going to be different, data distribution is going to be different, reporting is going to be different. There’s a finite set of patterns that you’ll find in standard DW methodology, but it’s up to you to read about them (Greg Rahn, Doug Burns, et al) and understand how they apply to your system, and not rely on Oracle’s approximation of a stats method for an average system.

Why do I need to manage the stats myself? Doesn’t Oracle do it automagically when they’re stale?

Doesn’t Oracle gather stats automagically when they’re stale?
Yes, it does, BUT:

  • Only if the window allocated to it allows for time
  • not stale ≠ representative stats .
    Or to rearrange the equation: your stats can be unrepresentative of your data, and the stats not be ‘stale’.

So even whilst they’re not “stale”, that’s not to say the global statistics for your table are still representative. After one day, the statistics are already becoming unrepresentative of the data (think max value of date, transaction number, etc), but are still not “stale”.
Oracle will, by default, consider a table “stale” once 10% has changed. But most DWs are going to be loading many millions of rows a day, so the 10% (default) change for a table to be considered stale is going to be quite high. A table loading 20 million rows per day will hit c.1 billion rows in total after less than two months. But of a billion rows, a hundred million (10%) need to change before the table’s statistics are “stale”. 20 into 100 goes 5 … so your statistics would only become “stale” roughly every five days.

There’s a good presentation from OpenWorld 2008 by Oracle’s Real World Performance Group, entitled Real-World Database Performance Techniques and Methods. In it they discuss statistics management in detail, including the following “Six Challenges to the Cost Based Optimizer”:

1. Data skew
2. Bind peeking
3. Column low/high values
4. Data correlation between columns
5. Cardinality Approximations
6. The debugging process

At least two of these (data skew, and column low/high values – out-of-range) can occur (which is bad, mm’kay?) with statistics which are STALE=FALSE.

The point is, if you’re serious about getting the best explain plan from the CBO, you can’t rely on STALE as a sole indicator of how representative your statistics are of your data.

Let’s remember why we even care about good statistics. Some people seem to think that it’s optional. That it’s the geek equivalent of spending every weekend lovingly polishing the exterior of one’s favourite car – nice to have and ideally should be done, but ultimately just for show and won’t make it go any faster.
The DB is there to support the users of whatever application it is. And users being users, want their answers now. This gives us our starting point, and a logical flow of conclusions drawn from this:

  • Our requirement is for performance, and repeatable, consistent performance.
    • To get this we want Oracle to execute the query as efficiently as possible.
    • To do this, Oracle needs to understand the data that it’s being asked to query.
    • If it doesn’t understand the data, how can we expect to access it in the most efficient way?
    • This understanding is imparted to Oracle through statistics.
    • So statistics need to be representative of the data.

As soon as you are changing data (eg a DW batch load), you need to consider whether the stats are still going to give the CBO the best chance of getting the right plan. If they aren’t as representative of your data as they could be then you can’t expect the CBO to come up with the best plan.
If your data doesn’t change much and once a week works for you then great. But the point is you need to understand your data, so that you can plan your statistics strategy around it so that Oracle can understand it.

Reading & References

Thanks to Greg Rahn for reviewing my post and suggesting some changes

May 19, 2011

OBIEE performance – get your database sweating

Filed under: bi, DWH, obiee, oracle, performance, rant, rrdtool — rmoff @ 16:01

Just because something produces the correct numbers on the report, it doesn’t mean you can stop there.

How you are producing those numbers matters, and matters a lot if you have an interest in the long-term health of your system and its ability to scale.

OBIEE is the case in point here, but the principle applies to any architecture with >1 tiers or components.

Let me start with a rhetorical question. The user has got a report which has ten rows of data. Which of the following methods is going to be a more efficient way to generate the report?

  1. Transfer the ten rows of data from the database back to the rendering application, and the rendered report to the user
  2. Transfer fourteen million rows of data from the database back to the rendering application, get the application to crunch these to the required ten rows, transfer rendered report to the user

Obviously, it’s the first one. In the second one (and this is no hyperbolic example to prove a point, I’m sorry to say) we have the following overheads:

  • Network traffic of fourteen million rows from the database to the application server
  • Disk and/or Memory impact on the application server, depending on how it’s processing those fourteen millions rows
  • CPU impact on the application server when it processes those fourteen million rows

Considering OBIEE specifically, you should be aiming to be able to answer all of your questions on the database directly. As soon as you start using the database simply as a source for dumping big volumes of rows into your OBIEE server, you’re storing up problems.
An RDBMS is designed for crunching lots of data. You’ve already lifted all that data off the disk when you selected it out of the tables on Oracle DB – why not get Oracle DB to do the additional processing required too? Where’s the benefit in lifting & shifting all of that data to then reprocess it again?
In fact, consider why you’re crunching big volumes of data each time in the first place. If multiple people have the same big queries, are you missing some aggregates in your data source that would support these queries much better? Or do you need to be looking towards multi-dimensional sources such as Oracle OLAP or Essbase?

The flexibility and power of OBIEE to do its own calculations and aggregations on data is a double-edged sword, and one to be wielded with responsibility. It is a great feature and one which cannot be avoided if you’re using federated queries across disparate sources. But if you’re using it out of ignorance or laziness to brute-force a solution instead of doing the big work at the lowest level possible then you’re asking for trouble.

If you rely on OBIEE to do the heavy work of your reporting solution, then you need to factor this in to your hardware spec for the machine. As a reporting interface to well aggregated data with fairly simple reports, we’ve found that it runs at minimal CPU, and doesn’t stress the disk. You can predict fairly reliably that this should scale just fine so long as your database can. But if you put the workload on the OBIEE server too, you’re going to hit bottlenecks much sooner.

The principle of moving as little data around as possible is described by Cary Millsap as “Filter Early” and described well in his blog article. Thanks to @RonCrisco for helping me remember the name. @cdturri pointed out that it’s also just common sense :-).
Applying it to a specific system, Exadata uses it in its SmartScan technology where it applies filtering of data directly on the storage rather than bringing all the data back up to the database SQL processing layer (h/t @ocpdba).

Case-study

Here’s an example of a situation where all is not well in OBIEE-land.

We were alerted to it by unix complaining that a filesystem was running low on space. Checking the contents of the filesystem we spotted these monsters:

[user@server]/data/bi/tmp $ls -lrt
total 112914646
[...]
-rw-------   1 user   biadmin    29122976800 Apr  6 11:32 nQS_20117_465_33898735.TMP
-rw-------   1 user   biadmin    24816966976 Apr  6 11:12 nQS_20117_464_33792457.TMP
-rw-------   1 user   biadmin    3582054936 Apr  6 11:46 nQS_20117_469_37979712.TMP
[...]

These are temporary files generated by BI Server (nqsserver), and for those of you viewing in black and white, those files are getting on for 30GB a go!

When queried, NQQuery.log embarrassingly admits facts such as:

Rows 13,894,550, bytes 3,260,497,648 retrieved from database query id: xxxx

and Usage Tracking shows the kind of damage being inflicted:

                      Total
                       time     row num db     cum num
START_TS     END_TS     sec   count  query      db row 

06-APR 10:05 10:18      579       0      6   3,436,816 
06-APR 10:05 10:18      553       0      4   3,239,101 
06-APR 10:05 10:18      383       0      3   1,624,656 
06-APR 10:11 11:48     5694       0      1  13,894,550 
06-APR 10:11 11:48     4314       0      1  11,840,156 
06-APR 10:21 10:27      336     456      4   3,239,101 

A look at the machine’s vital statistics for this time period shows the impact:

Affected BI Server, showing impact of workload which quietens down c.12:00

For a bit more detail, here’s the time period at greater resolution:

Systems metric during the heavy report execution

Notice that the server starts paging out during the work, and there’s a lot of disk activity – both read and write. CPU goes from a normal c.5% up to 20-30%.

This was one user doing this — care to place bets on how the system would perform if it were rolled out to ten users running this kind of workload?

For reference, here’s one of our other BI Servers which serves at least 10 times as many users, where the reports do the bulk of their work in the database:

Another BI Server on the same day, with a greater number of users but reports which do their big work on the database

Monitoring for problems

There are a few easy ways to look out for this bad behaviour. The first is in Usage Tracking, where you can look at S_NQ_ACCT.CUM_NUM_DB_ROW and compare it to S_NQ_ACCT.ROW_COUNT, even writing an alert for when this ratio goes above a defined threshold.
You could also look at an alert on S_NQ_ACCT.CUM_NUM_DB_ROW going above a fixed number, since depending on your system’s purpose and architectural principles you might want to aim to never be pulling back more rows from the database than necessary for a report.

I’d also pay close attention to S_NQ_ACCT.NUM_DB_QUERY, as this will show you reports generating more than one query on the database and thus increasing the workload on the BI Server processing the combined results.

Another thing to check is the NQQuery.log, looking at the number of bytes returned from a database query. This could feed into some kind of generated alert for closer investigation if a query returns above a certain number.
OBI 10g:

grep retrieved NQQuery.log|awk '{print $5}'|sort -n

OBI 11g:

grep retrieved NQQuery.log|awk '{print $20}'|sort -n

(if you’re running on Windows then to run this command you’ll need either cygwin or google for a Win32 version of grep/awk/sort – or brew your own Powershell version)

I’d also strongly recommend monitoring your BI Server’s TEMP folder (defined as WORK_DIRECTORY_PATHS in NQSConfig.INI), as this is where it lands the data to disk when it’s got to crunch it. Monitor this for two reasons – to spot when bad stuff’s happening, but also in case it fills up and causes your BI Server to barf. For the latter, you can expect to get:

[nQSError: 10058] A general error has occurred. 
[nQSError: 46118] Out of disk space. 

Developing for the long term

How do you assess your development projects for quality?
You presumably are keen that the reports match the specifications and return the right numbers. You hopefully also have NFRs for how quickly these reports run.
But what about system impact of new developments? How do you quantify this?

Unless you are delivering a standalone project, fire-and-forget, then maybe you can performance test for load and concurrency up-front to validate how well your solution will scale to the required users.
But lots of BI projects are iterative and may well be across functions too. Just because your development project is first to land it doesn’t give you the right to dump a steaming pile on the servers and proclaim that it works with your user volumes and meets their NFRs, so all is well. What about all the projects that come along next, and are going to be hindered by your mess?

This is where another double-edged sword comes into play – “Best Practice”. For me, Best Practice is a way of doing something that multiple implementations, time and expertise has shown to be the best way of not screwing up. It is the starting point from which to work, understanding deviations as required. What it is not, and what gets it the bad reputation, is a fixed set of crude rules to be adhered to blindly and implemented without questioning or understanding.

If a system is not adhering to the kind of best practice I’m talking about here – filter early, in essence – then there may be a good reason. But that reason must be consciously and loudly acknowledged and documented.

April 11, 2011

Entertaining Exadata FUD from HP

Filed under: DWH, Exadata, HP, oracle — rmoff @ 09:06

Chris Mellor at The Register posted an interesting article a couple of days ago, entitled HP and Violin build Oracle Exadata killer. The slidedeck has been removed from HP’s FTP site, but a bit of Google magic throws up a couple of mirror copies.

It’s an entertaining read (“Do a Proof of Concept! 94% win rate!! We can and do win against Exadata!!”), and a nice illustration of the FUD techniques that companies use in marketing their products against others. Greg Rahn has taken Netezza to task in the past for this, and to be fair at least Netezza had a serious white paper to back up their arguments. HP’s deck (including choice sections such as “How to sell against Exadata”) is IMHO nothing more than a biased set of arguments for salespeople to use to attempt to bullshit customers.

The deck is entirely aimed at OLTP workloads, and lays all its weight on the IOPS you’ll get from lots of Flash memory (the Violin bit). As any ful kno, building a Data Warehouse on a system based on IOPS with no reference to throughput (GB/s), it doomed to painful failure. My understanding of Exadata is that it’s in part all about a properly balanced configuration. Unbalance this configuration at your peril, as you’ll start pushing unidentified bottlenecks around your system.

Kevin Closson (ex-Oracle performance architect on Exadata, now at EMC), commented on The Register article:

By my assessment the HPDBS (DL980 + Violin solution) is likely not positioned as an Exadata killer for bandwidth-sensitive DW/BI workloads. It simply doesn’t have enough high-bandwidth storage plumbing.

Ironically for HP, they actually quote Kevin in their slide deck with a selective quotation from his blog article about a TPC-H benchmark result here. The quote is used to imply that Exadata isn’t anything other than just disks thrown together. If you’re going to selectively quote, how about this one in the next paragraph of the same article – “I’m just comparing one Oracle Database 11g result to another Oracle Database 11g resul[…]The benchmark result was outstanding and it was Oracle technology in both the Database and Storage grid[…]” …

Kevin goes on to comment on HPDBS:

On the other hand, a single-rack Exadata only supports a scalable read:write ratio of 40:1 (their data sheet 1,000,000 RIOP : 50,000 WIOPS). Actually, that 50,000 WIOPS is a gross number accounting neither for redundant writes (ASM redundancy) nor the larger sequential writes that a transaction processing system also must concurrently sustain. In other words, mileage varies (downward trend)

Maybe HPDBS is a good solution, maybe it’s not. The deck certainly wasn’t published for public consumption so maybe it’s unfair to judge it on that. But it’s an interesting peek into the murky workings of technical sales. I’d be naïve to think that there isn’t a whole bunch of Oracle decks with similar “how to sell against xxxx” sections.

At the end of the day, solutions need to be judged on hard facts and whole pictures alone. For that reason, I’d take the technical blogs of respected writers any day above a sales pitch. Kevin Closson is a good example of this – working for a competitor he could easily have taken the opportunity to stick the knife in to Exadata, but as a respected technical writer he lets the facts speak for themselves.

Older Posts »

Blog at WordPress.com.