rmoff

October 10, 2011

Instrumenting OBIEE – the final chapter


This article has been superseded by a newer version: Instrumenting OBIEE Database Connections For Improved Performance Diagnostics


(Previously on this blog: 1, 2, 3)

Summary

Instrument your code.
Stop guessing.
Make your DBA happy.
Make your life as a BI Admin easier.

The Problem

OBIEE will typically connect to the database using a generic application account.
(Hopefully, you’ll have isolated it to an account used only for this purpose – if you haven’t, you should.)

The problem is that you lose a lot of visibility of work both up and down the stack.

  • An OBIEE query is causing a problem on the database – how do you identify the originator?
  • You want to investigate the performance of an OBIEE query, but how do you identify which DB session it is?

We know SID 491 is causing a problem, but how do we identify the originating OBIEE user?

You could start piecing together Usage Tracking and NQQuery.log files, but it’s hardly convenient or instantaneous is it?

The solution

By taking advantage of native Oracle procedures, we can instrument our OBIEE code to pass through lots of valuable information:

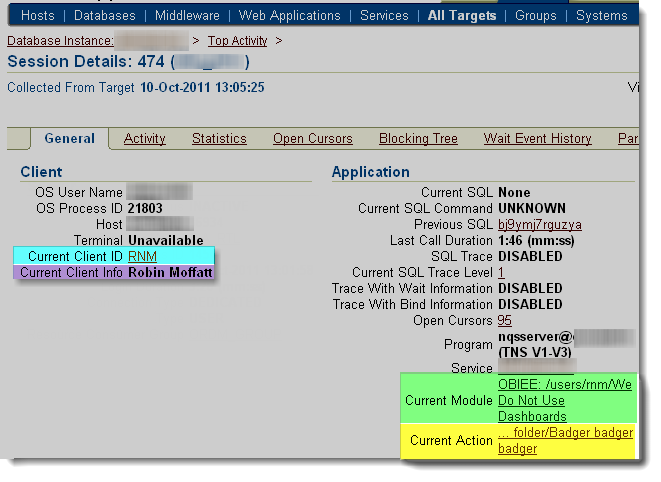
Now we can see which OBIEE user fired the query resulting in SID 491, and not only the user, but the dashboard and request name they are running.

This works in both OBIEE 10g and 11g.

See my previous post here for further background, and discussion of the procedures used.

Implementing it – overview

In essence, we harness internal OBIEE session variables which hold the user ID, name, dashboard and report name. We put a set of database calls on the connection pool(s) associated with query requests.

We have to do a bit of trickery to work around two issues.

Firstly, the variables may not be set (you may not have saved your new request yet, or may be running it outside of a dashboard). To get around this, we create two dummy session variables with the same names, and populate them with dummy init blocks.

Secondly, there is a limitation to the number of characters that can be passed through, and so we manipulate the string if necessary to use the right-most characters.

Implementing it – Init Block and Dummy Variables

Summary:

Create two init block/session variable pairs:

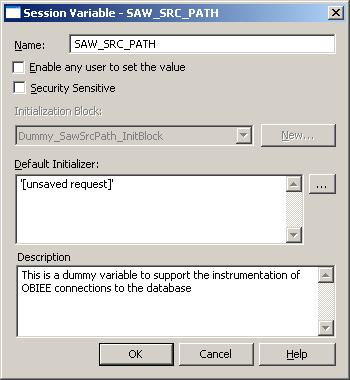
Session Variables

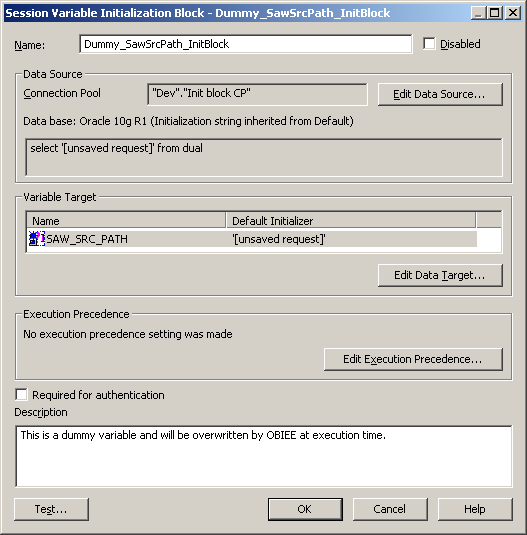
Initialisation Blocks

Be sure to use a connection pool which isn’t used for queries.

Step-by-step

Load up your RPD. If you haven’t already, create a new connection pool that is just for these init blocks. It can be to any database – in the examples below it’s an Oracle one, but any that supports selecting from a dummy table like DUAL in Oracle.

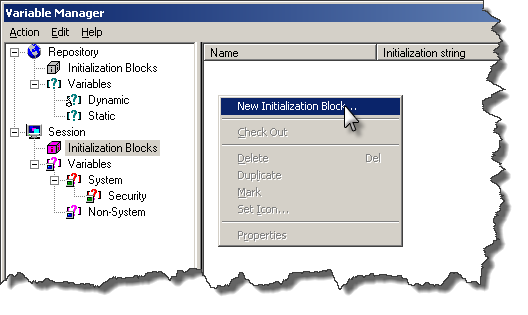
Go to Manage -> Variables, click on Session -> Initialisation Blocks. Right click in the section to the right, and select New Initialization Block.

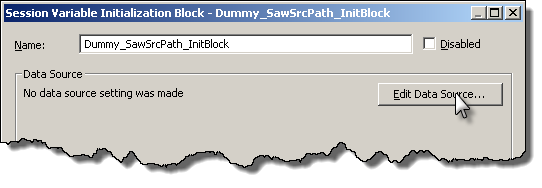
Call the init block Dummy_SawSrcPath_InitBlock, and then click on “Edit Data Source”

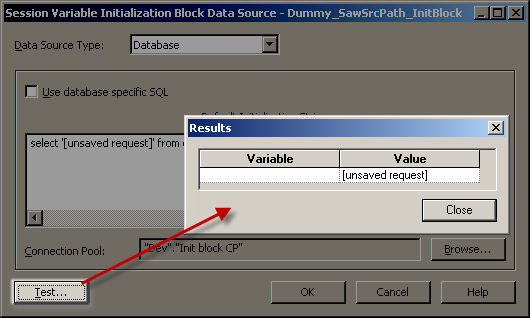
Set the Data Source Type to Database, and the init string to

select '[unsaved request]' from dual

Click on Browse to set the Connection Pool used. The connection pool should be one exclusively for init blocks (not the same you use for queries). If you try to use the same connection pool as for queries, you’ll most likely get an error when you logon.

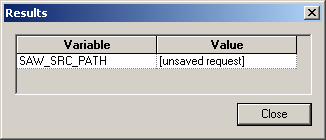
Once you’ve set the connection pool, click on Test – you should get a result as shown:

If the Test doesn’t succeed then you need to fix the problem before you continue.

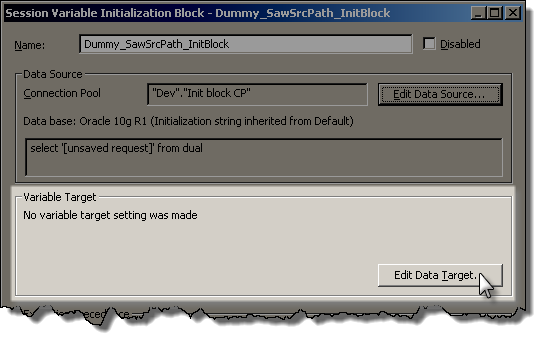
Assuming it’s worked, click OK to return to the Init Block creation window. We now want to define the dummy variable, so to do so click on “Edit Data Target”:

Click on New to create a new variable, and give it the name SAW_SRC_PATH. Make sure you get the name exactly correct, no typos.
Give it a default initializer, and then click OK.

Make sure your init block setup now looks like this:

Click on Test, and expect to get this returned:

Assuming it works, then click OK to save the new Init Block and Variable.

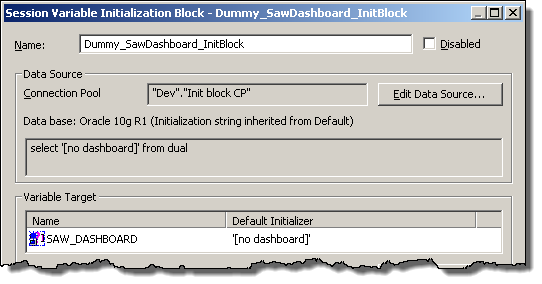
Repeat as above to create an init block/variable pair for SAW_DASHBOARD, looking like this:

When you’ve finished, you should have two init block/variables pairs set up like this:

Session Variables

Initialisation Blocks

Implementing it – connection pool

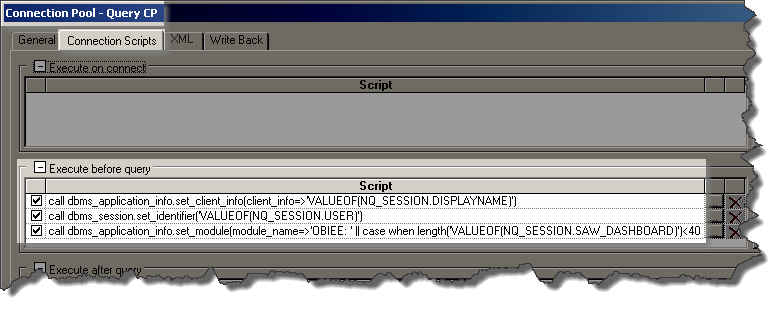
Add these three SQL statements to the “Execute before query” of “Connection Scripts” of each Connection Pool which is used for queries.
Do not add them to ones which are used for init blocks / authentication etc.

call dbms_application_info.set_client_info(client_info=>'VALUEOF(NQ_SESSION.DISPLAYNAME)')
call dbms_session.set_identifier('VALUEOF(NQ_SESSION.USER)')
call dbms_application_info.set_module(module_name=>'OBIEE: ' || case when length('VALUEOF(NQ_SESSION.SAW_DASHBOARD)')<40 then 'VALUEOF(NQ_SESSION.SAW_DASHBOARD)' else '...' || substr('VALUEOF(NQ_SESSION.SAW_DASHBOARD)',-37) end,action_name=>case when length('VALUEOF(NQ_SESSION.SAW_SRC_PATH)')<31 then 'VALUEOF(NQ_SESSION.SAW_SRC_PATH)' else '...' || substr('VALUEOF(NQ_SESSION.SAW_SRC_PATH)',-28) end);

This sets values as follows:

  • Client Identifier is the OBIEE login user id
  • Client Info is the user’s display name.
  • Module and Action are populated with the dashboard name (prefixed by “OBIEE”) and report names respectively, truncated to the left if necessary to fit into the field size.

NB CLIENT_IDENTIFIER and CLIENT_INFO have a larger capacity so could be used if you want to view more of the report/dashboard detail:

V$SESSION column      Max value length
MODULE                47
ACTION                31
CLIENT_INFO           63
CLIENT_IDENTIFIER     63

Reference:
DBMS_APPLICATION_INFO
DBMS_SESSION

Testing the changes

If you’re currently logged into Answers, logout and log back in. This is necessary for the dummy session variables to populate.

Run this sql*plus SQL script below to look at any existing OBIEE queries running on the database.


set linesize 170
col program for a30
col client_info for a20
col client_identifier for a18
col module for a47
col action for a31

SELECT SID,PROGRAM, CLIENT_IDENTIFIER, CLIENT_INFO, MODULE, ACTION FROM V$SESSION WHERE LOWER(PROGRAM) LIKE 'nqsserver%';

Now login to Answers, and run an existing report, or create a new one. When you re-run the SQL script you should see your session now listed:

Not a fan of sql*plus?

If for some strange reason you don’t love sql*plus, you can obviously use the above SQL in any other SQL client. Or, you can fire up Enterprise Manager and see the same set of information:

(run at a different time from the SQL above, so different report and dashboard names)

Warning

It’s occurred to me that by parsing in user-provided values to a string that’s executed on the database, there could be the potential for a breach through SQL Injection via a maliciously named report or dashboard.

I’ve not been able to find a report name which does cause trouble, but I have never tried exploiting SQL injection before.

It is another good reason to make sure that you’re using a DB account solely created for reporting queries from OBIEE, because then its privileges can be greatly restricted. This isn’t an excuse not to test for SQL Injection, but a reminder of why good practices such as granting of least privileges exist.

Troubleshooting

  • Make sure you don’tsuffix the database calls with semi-colons (statement terminators). If you do you’ll probably get an error like this:
    [nQSError: 17001] Oracle Error code: 911, message: ORA-00911: invalid character at OCI call OCIStmtExecute
    
  • If you’re having problems implementing this, or doing further playing around with it, you can see the exact SQL that’s executed on connection by bumping up LOGLEVEL and checking NQQuery.log.
  • Don’t use the same connection pool for the init blocks as you do for queries. If you try this, then the init blocks will fire and try to submit a command on the database which requires the variables that the very init blocks are trying to populate. Confused? OBIEE certainly will be too.
  • If someone creates a report or dashboard with single quote in the name, it causes problems. The error will be ambiguous too:

    State: HY000. Code: 10058. [NQODBC

August 18, 2011

A quotation to print out and stick on your wall

Filed under: performance, quotation — rmoff @ 09:25

Here’s a quotation that I’ve just read and wanted to share. It is all part of a BAAG approach to troubleshooting problems, performance in particular.

From Greg Rahn (web|twitter) on oracle-l:

There are always exceptions, but exceptions can be justified and supported with data. Just beware of the the silver bullet syndrome…

The unfortunate part […] is that rarely anyone goes back and does the root cause analysis. It tends to fall into the bucket of “problem…solved”.

(Source)

June 28, 2011

Oracle 11g – How to force a sql_id to use a plan_hash_value using SQL Baselines

Filed under: etl, oracle, performance, plan management, sql plan baseline — rmoff @ 14:13

Here’s a scenario that’ll be depressingly familiar to most reading this: after ages of running fine, and no changes to the code, a query suddenly starts running for magnitudes longer than it used to.

In this instance it was an ETL step which used to take c.1 hour, and was now at 5 hours and counting. Since it still hadn’t finished, and the gods had conspired to bring down Grid too (unrelated), I generated a SQL Monitor report to see what was happening:

select DBMS_SQLTUNE.REPORT_SQL_MONITOR(
   type=>'HTML',
   report_level=>'ALL',sql_id=>'939abmqmvcc4d') as report
FROM dual;

(h/t to Martin Berger for this)

It showed a horrendous explain plan:

A very naughty plan

Using Kerry Osborne’s script to look at the plan_hash_value over time from AWR, it was clear that the CBO had picked a new, bad, explain plan.

So we knew the sql_id, and we knew the plan_hash_value of the plan which we wanted the CBO to use. But how to do this?

Back to Kerry Osborne again, and his article about SQL Plan Baselines. He (and others) write in detail about how and what SQL Plan Baselines are, but in essence it lets you tell Oracle which plan to use (or optionally, prefer) for a given sql_id.

Since the desired plan_hash_value was no longer in the cursor cache, we could get it back from AWR, loaded in via a SQL Tuning Set. Here’s the code with in-line comments explaining the function of each block:

/* 
Set up a SQL Baseline using known-good plan, sourced from AWR snapshots
https://rnm1978.wordpress.com/

In this example, sql_id is 939abmqmvcc4d and the plan_hash_value of the good plan that we want to force is 1239572551
*/

-- Drop SQL Tuning Set (STS)
BEGIN
  DBMS_SQLTUNE.DROP_SQLSET(
    sqlset_name => 'MySTS01');
END;

-- Create SQL Tuning Set (STS)
BEGIN
  DBMS_SQLTUNE.CREATE_SQLSET(
    sqlset_name => 'MySTS01',
    description => 'SQL Tuning Set for loading plan into SQL Plan Baseline');
END;

-- Populate STS from AWR, using a time duration when the desired plan was used
--  List out snapshot times using :   SELECT SNAP_ID, BEGIN_INTERVAL_TIME, END_INTERVAL_TIME FROM dba_hist_snapshot ORDER BY END_INTERVAL_TIME DESC;
--  Specify the sql_id in the basic_filter (other predicates are available, see documentation)
DECLARE
  cur sys_refcursor;
BEGIN
  OPEN cur FOR
    SELECT VALUE(P)
    FROM TABLE(
       dbms_sqltune.select_workload_repository(begin_snap=>22673, end_snap=>22710,basic_filter=>'sql_id = ''939abmqmvcc4d''',attribute_list=>'ALL')
              ) p;
     DBMS_SQLTUNE.LOAD_SQLSET( sqlset_name=> 'MySTS01', populate_cursor=>cur);
  CLOSE cur;
END;
/

-- List out SQL Tuning Set contents to check we got what we wanted
SELECT 
  first_load_time          ,
  executions as execs              ,
  parsing_schema_name      ,
  elapsed_time  / 1000000 as elapsed_time_secs  ,
  cpu_time / 1000000 as cpu_time_secs           ,
  buffer_gets              ,
  disk_reads               ,
  direct_writes            ,
  rows_processed           ,
  fetches                  ,
  optimizer_cost           ,
  sql_plan                ,
  plan_hash_value          ,
  sql_id                   ,
  sql_text
   FROM TABLE(DBMS_SQLTUNE.SELECT_SQLSET(sqlset_name => 'MySTS01')
             );

-- List out the Baselines to see what's there
SELECT * FROM dba_sql_plan_baselines ;

-- Load desired plan from STS as SQL Plan Baseline
-- Filter explicitly for the plan_hash_value here if you want
DECLARE
my_plans pls_integer;
BEGIN
  my_plans := DBMS_SPM.LOAD_PLANS_FROM_SQLSET(
    sqlset_name => 'MySTS01', 
    basic_filter=>'plan_hash_value = ''1239572551'''
    );
END;
/

-- List out the Baselines
SELECT * FROM dba_sql_plan_baselines ;

Now when the query’s run, it will use the desired plan.

Things to note:

  • In 10g and 11gR1 the default for SELECT_WORKLOAD_REPOSITORY is to return only BASIC information, which excludes the plan! So DBMS_SPM.LOAD_PLANS_FROM_SQLSET doesn’t load any plans.
    • It doesn’t throw a warning either, which it could sensibly, since the STS has no plan, and it can see that</grumble>
    • This changes to TYPICAL in 11gR2 (thanks Surachart!)
  • Parameter “optimizer_use_sql_plan_baselines” must be set to TRUE for a baseline to be used
  • Flush the cursor cache after loading the baseline to make sure it gets picked up on next execution of the sql_id

References:

Thanks to John Hallas for his help with this problem.

May 19, 2011

OBIEE performance – get your database sweating

Filed under: bi, DWH, obiee, oracle, performance, rant, rrdtool — rmoff @ 16:01

Just because something produces the correct numbers on the report, it doesn’t mean you can stop there.

How you are producing those numbers matters, and matters a lot if you have an interest in the long-term health of your system and its ability to scale.

OBIEE is the case in point here, but the principle applies to any architecture with >1 tiers or components.

Let me start with a rhetorical question. The user has got a report which has ten rows of data. Which of the following methods is going to be a more efficient way to generate the report?

  1. Transfer the ten rows of data from the database back to the rendering application, and the rendered report to the user
  2. Transfer fourteen million rows of data from the database back to the rendering application, get the application to crunch these to the required ten rows, transfer rendered report to the user

Obviously, it’s the first one. In the second one (and this is no hyperbolic example to prove a point, I’m sorry to say) we have the following overheads:

  • Network traffic of fourteen million rows from the database to the application server
  • Disk and/or Memory impact on the application server, depending on how it’s processing those fourteen millions rows
  • CPU impact on the application server when it processes those fourteen million rows

Considering OBIEE specifically, you should be aiming to be able to answer all of your questions on the database directly. As soon as you start using the database simply as a source for dumping big volumes of rows into your OBIEE server, you’re storing up problems.
An RDBMS is designed for crunching lots of data. You’ve already lifted all that data off the disk when you selected it out of the tables on Oracle DB – why not get Oracle DB to do the additional processing required too? Where’s the benefit in lifting & shifting all of that data to then reprocess it again?
In fact, consider why you’re crunching big volumes of data each time in the first place. If multiple people have the same big queries, are you missing some aggregates in your data source that would support these queries much better? Or do you need to be looking towards multi-dimensional sources such as Oracle OLAP or Essbase?

The flexibility and power of OBIEE to do its own calculations and aggregations on data is a double-edged sword, and one to be wielded with responsibility. It is a great feature and one which cannot be avoided if you’re using federated queries across disparate sources. But if you’re using it out of ignorance or laziness to brute-force a solution instead of doing the big work at the lowest level possible then you’re asking for trouble.

If you rely on OBIEE to do the heavy work of your reporting solution, then you need to factor this in to your hardware spec for the machine. As a reporting interface to well aggregated data with fairly simple reports, we’ve found that it runs at minimal CPU, and doesn’t stress the disk. You can predict fairly reliably that this should scale just fine so long as your database can. But if you put the workload on the OBIEE server too, you’re going to hit bottlenecks much sooner.

The principle of moving as little data around as possible is described by Cary Millsap as “Filter Early” and described well in his blog article. Thanks to @RonCrisco for helping me remember the name. @cdturri pointed out that it’s also just common sense :-).
Applying it to a specific system, Exadata uses it in its SmartScan technology where it applies filtering of data directly on the storage rather than bringing all the data back up to the database SQL processing layer (h/t @ocpdba).

Case-study

Here’s an example of a situation where all is not well in OBIEE-land.

We were alerted to it by unix complaining that a filesystem was running low on space. Checking the contents of the filesystem we spotted these monsters:

[user@server]/data/bi/tmp $ls -lrt
total 112914646
[...]
-rw-------   1 user   biadmin    29122976800 Apr  6 11:32 nQS_20117_465_33898735.TMP
-rw-------   1 user   biadmin    24816966976 Apr  6 11:12 nQS_20117_464_33792457.TMP
-rw-------   1 user   biadmin    3582054936 Apr  6 11:46 nQS_20117_469_37979712.TMP
[...]

These are temporary files generated by BI Server (nqsserver), and for those of you viewing in black and white, those files are getting on for 30GB a go!

When queried, NQQuery.log embarrassingly admits facts such as:

Rows 13,894,550, bytes 3,260,497,648 retrieved from database query id: xxxx

and Usage Tracking shows the kind of damage being inflicted:

                      Total
                       time     row num db     cum num
START_TS     END_TS     sec   count  query      db row 

06-APR 10:05 10:18      579       0      6   3,436,816 
06-APR 10:05 10:18      553       0      4   3,239,101 
06-APR 10:05 10:18      383       0      3   1,624,656 
06-APR 10:11 11:48     5694       0      1  13,894,550 
06-APR 10:11 11:48     4314       0      1  11,840,156 
06-APR 10:21 10:27      336     456      4   3,239,101 

A look at the machine’s vital statistics for this time period shows the impact:

Affected BI Server, showing impact of workload which quietens down c.12:00

For a bit more detail, here’s the time period at greater resolution:

Systems metric during the heavy report execution

Notice that the server starts paging out during the work, and there’s a lot of disk activity – both read and write. CPU goes from a normal c.5% up to 20-30%.

This was one user doing this — care to place bets on how the system would perform if it were rolled out to ten users running this kind of workload?

For reference, here’s one of our other BI Servers which serves at least 10 times as many users, where the reports do the bulk of their work in the database:

Another BI Server on the same day, with a greater number of users but reports which do their big work on the database

Monitoring for problems

There are a few easy ways to look out for this bad behaviour. The first is in Usage Tracking, where you can look at S_NQ_ACCT.CUM_NUM_DB_ROW and compare it to S_NQ_ACCT.ROW_COUNT, even writing an alert for when this ratio goes above a defined threshold.
You could also look at an alert on S_NQ_ACCT.CUM_NUM_DB_ROW going above a fixed number, since depending on your system’s purpose and architectural principles you might want to aim to never be pulling back more rows from the database than necessary for a report.

I’d also pay close attention to S_NQ_ACCT.NUM_DB_QUERY, as this will show you reports generating more than one query on the database and thus increasing the workload on the BI Server processing the combined results.

Another thing to check is the NQQuery.log, looking at the number of bytes returned from a database query. This could feed into some kind of generated alert for closer investigation if a query returns above a certain number.
OBI 10g:

grep retrieved NQQuery.log|awk '{print $5}'|sort -n

OBI 11g:

grep retrieved NQQuery.log|awk '{print $20}'|sort -n

(if you’re running on Windows then to run this command you’ll need either cygwin or google for a Win32 version of grep/awk/sort – or brew your own Powershell version)

I’d also strongly recommend monitoring your BI Server’s TEMP folder (defined as WORK_DIRECTORY_PATHS in NQSConfig.INI), as this is where it lands the data to disk when it’s got to crunch it. Monitor this for two reasons – to spot when bad stuff’s happening, but also in case it fills up and causes your BI Server to barf. For the latter, you can expect to get:

[nQSError: 10058] A general error has occurred. 
[nQSError: 46118] Out of disk space. 

Developing for the long term

How do you assess your development projects for quality?
You presumably are keen that the reports match the specifications and return the right numbers. You hopefully also have NFRs for how quickly these reports run.
But what about system impact of new developments? How do you quantify this?

Unless you are delivering a standalone project, fire-and-forget, then maybe you can performance test for load and concurrency up-front to validate how well your solution will scale to the required users.
But lots of BI projects are iterative and may well be across functions too. Just because your development project is first to land it doesn’t give you the right to dump a steaming pile on the servers and proclaim that it works with your user volumes and meets their NFRs, so all is well. What about all the projects that come along next, and are going to be hindered by your mess?

This is where another double-edged sword comes into play – “Best Practice”. For me, Best Practice is a way of doing something that multiple implementations, time and expertise has shown to be the best way of not screwing up. It is the starting point from which to work, understanding deviations as required. What it is not, and what gets it the bad reputation, is a fixed set of crude rules to be adhered to blindly and implemented without questioning or understanding.

If a system is not adhering to the kind of best practice I’m talking about here – filter early, in essence – then there may be a good reason. But that reason must be consciously and loudly acknowledged and documented.

March 11, 2011

Getting good quality I/O throughput data

Filed under: AWR, io, oracle, performance, visualisation — rmoff @ 11:33

This post expands on one I made last year here about sampling frequency (of I/O throughput, but it’s a generic concept).
The background to this is my analysis of the performance and capacity of our data warehouse on Oracle 11g.

Before I get too boring, here’s the fun bit:

Pork Pies per Hour (PP/h)

Jim wants to enter a championship pork-pie eating competition. He’s timed himself practising and over the course of an hour he eats four pork pies. So we might say that his Pork Pies per Hour (PP/h) rate is 4.

The competition lasts for thirty minutes. The world champion can eat eight pork pies in thirty minutes. Does Jim stand a chance?
(let’s pretend he has an insatiable appetite and isn’t going to get full, and all other smart-ass factors)

If his consumption rate was 4 PP/h, and he only has half an hour, then we would predict he’ll consume 4 * 0.5 = 2 pork pies. So Jim’s going to get his ass beat.

Or is he?

What if the rate of 4 PP/h masks the fact that the hour broke down as follows:

  • First 15 minutes: he ate one pork pie
  • 15 – 30 minutes: had a beer
  • 30 – 45 minutes: gobbled down three pork pies
  • 45 – 60 minutes: he had another beer and gently sweated pork fumes?

If that were the case and we had sampled every fifteen minutes, we’d see this:

So what we want to know, which is the maximum rate at which he can consume pork pies, is exposed only when we sample at an appropriate frequency.

Mega bites to Mega bytes

Enough of pork pies, and back to the tasty subject of I/O throughput. The point I am trying to make is that without an appropriate sample size the data that we have becomes less useful.

You can always process your data further to derive conclusions from it over a longer term. Five second samples are going to be fairly unintelligible if considered unprocessed over the timespan of a year.

But what you can’t do is add back in the detail that you lost by sampling with too great a frequency. Once that moment’s passed, it’s gone.

By the nature of metric which is a rate at which something happens, the sample is going to be an average over the sampling period. The problem with this is that it can mask peaks in the throughput. Peaks may (or may not) be hitting a ceiling in your system which an average figure will make you think you are plenty clear of.

System metrics for Oracle are available through AWR, which typically samples every hour. OS-level tools may sample more frequently, but in the context of capacity planning and analysis, periods are often going to be 10s of minutes, or hourly and upwards.

The following illustrates the effect of averaging I/O throughput figures.

The data is the average I/O throughput, sampled every five seconds (through this method). Note that already this is an average, but in the context of hourly samples (for example) we will have to live with five seconds as the starting point.

This first graph shows the original data, with a five minute average drawn over it. For each, the maximum is noted.
It can be seen that the maximum the I/O throughput hit was a shade over 3GB/s. That was the real maximum that we were driving through the I/O pipe over the period of time (ignoring that it’s a 5-second average). Now look at the maximum of the 5 minute average – we lost c240MB/s in our maximum, which is now 2.7GBs.

In the second graph the original sample is shown, with a 30 minute average. It’s clear to see the effect of averaging the data has – the peaks and troughs are smoothed out, giving a more even line. But is this what we want? Our apparent maximum I/O based on a 30 minute average has now almost halved!
Apparently, we only needed 1.6GB/s of I/O throughput during this time period. The graph clearly shows that this is a false statement. But what about now?

Same graph as before, but without the context of the original sample. Given this data – which is what you’ll have if you collect I/O throughput data that’s sampled every 30 minutes – then how would you know what the maximum throughput during that period was? It is impossible to know!

Pushing this point further, the same 30 minute average, over an extended period:

What’s the maximum throughput that was required during this period? When was the I/O throughput approaching capacity?
You can’t know from the averaged data alone!

Here’s the same extended period, with the original 5 second samples. This is just proving the point, that the 30 minute samples have obliterated the peaks particularly around 04:00 – 06:00.

So what?

To be able to plan for a system’s I/O capacity we need to know more than how much I/O it transferred over a relatively long period of time. We need to know what the biggest demand it put on the system was, otherwise we risk unseen bottlenecks. To make this useful, we also need to understand if these big demands were prolonged peaks or not. Particularly in a DW/BI environment, load is generally going to be sporadic. Sure, we run regular batches at predictable times, and may look to cache reports at fixed times, but they’re exceptions not the rule.

If a system has a limit of 3GB/s, and we hit that 3GB/s for a few seconds, what is the implication of that? We need to transfer the same amount of data, so hitting the limit means that the transfer is going to take longer. But a few seconds here and there may not matter — it all comes down to the context.

A report that runs for five minutes which hits I/O throughput limit for a second or two isn’t as much of a concern as one where the I/O hits the limit for minutes on end. There’s plenty written about system capacity and scalability, and it should be clear that if a system is hitting a capacity limit (whether it’s I/O, CPU, or whatever) for prolonged periods then the overall stability is going to suffer. Maybe that five minute report which spends four minutes on bottlenecked I/O doesn’t bother the user, but what about the report that’s supposed to run in a few seconds which is sat waiting for I/O at the same time?

(Ed: I’m pretty sure that I’m straying into the realm of knees and such, but need (knee’d?) to go off an read some more about it first to be sure)

I love twitter

In writing this, I’ve been struggling with some of the concepts which I can instinctively feel but don’t have the understanding to properly articulate. Particularly, if my assertion is that long sample periods are not a good idea, what is a good sample period? It’s no use being a smart-ass and rubbishing the data we collect if I can’t explain how we should collect it.

So, I turned to twitter. Twitter is awesome. (I think of Chet almost everytime I say this because he was one of the main guys who convinced me it was as good as the fuss made out. Check out his presentation all about it here here).

and back the answers came:

twitter is teh awesome

twitter is teh awesome

Amazingly helpful stuff, and focussed on my specific question. Sure, Google has changed our lives when it comes to finding the answers to questions. But (a) there is a lot of crap written on the internet (Blunder On So, anyone?), and (b) you will often find generally interesting things in the area in which you are interested, but for the more specific uncommon questions it’s unlikely you’ll get a direct hit.

Here, I had industry-leading figures directly answering my specific question! I love twitter. And I really appreciate experts taking the time to share their knowledge, experience and expertise.

What next?

Nothing that I’m writing here is new, but I enjoy writing things down to clarify my thoughts.

Courtesy of the good folk of twitter, I have some great links to follow up and digest.

February 2, 2011

Instrumenting OBIEE for tracing Oracle DB calls

Filed under: log, monitoring, obiee, oracle, performance, usagetracking — rmoff @ 15:04

Cary Millsap recently published a paper “Mastering Performance with Extended SQL Trace” describing how to use Oracle trace to assist with troubleshooting the performance of database queries.
As with all of Cary Millsap’s papers it is superbly written, presenting very detailed information in a clear and understandable way. (and yes I do have a DBA crush ;-))
It discusses how you can automate the tracing of specific sessions on the database, and requiring the application to be appropriately instrumented. This reminded me of a post that I made almost exactly 12 months ago here, where I explained how to pass through the username of the OBIEE user to the database. Initially I thought it would be useful simply for being able to pin a rogue query to an end-user, but reading Cary’s paper made me realise there is more potential to it.

Why would you use it in OBIEE?

Essentially, it enables you to precisely identify DB connections coming in from OBIEE. Since you can identify the connections, you can then trace them or collect additional statistics on them.

In Production, this would be useful for helping with troubleshooting. If a query is behaving badly, the responsible user can be easily identified, and through the login ID matched back to Usage Tracking data (you do collect Usage Tracking data, right?). Conversely, if a user is complaining (unlikely, I know 😉 ) of performance issues you can easily spot their queries running on the database and get a head start on identifying the problem.

As well as tracing, you can use these attributes to collect statistics (eg I/O wait time, db time, etc) for specific users or application areas. You use the DBMS_MONITOR CLIENT_ID_STAT_ENABLE procedure and then view the stats in V$CLIENT_STAT. Similar proc & V$ table exist for module-targeted statistics collecting.

Implementation

In essence, all you do is use the OBIEE Connection Scripts setting in the appropriate Connection Pool to call one or more of the PL/SQL packages. The values that you can set on the connection are as follows:

V$SESSION column Corresponding connection command to set Max value length
MODULE dbms_application_info.set_module(module_name=>'[…]’,action_name =>NULL) 47
ACTION dbms_application_info.set_module(module_name=>'[…]’,action_name=>'[…]’)
or
dbms_application_info.set_action(action_name=>'[…]’)
31
CLIENT_INFO dbms_application_info.set_client_info 63
CLIENT_IDENTIFIER dbms_session.set_identifier 63

(Ref: DBMS_APPLICATION_INFO, DBMS_SESSION)

For example, to pass through the OBIEE username and display name (NQ_SESSION.USER and NQ_SESSION.DISPLAYNAME respectively) you would use the following code:

Connection Pool settings

When you look at V$SESSION for the connection from OBIEE, it would show up something like this:

V$SESSION showing values from OBIEE connection

Instrument individual reports

What would be really cool would be if we could pass through the details of the report being executed.
A rather clunky way of doing this is by setting a custom session variable in the Logical SQL that gets sent to BI Server:

Then add a script to the connection pool to pass this value through in the database connection:

When run this then shows up on V$SESSION as:

col client_identifier for a20
col client_info for a20
SELECT PROGRAM, CLIENT_IDENTIFIER, CLIENT_INFO, MODULE, ACTION FROM V$SESSION WHERE LOWER(PROGRAM) LIKE 'nqsserver%';

You get an error if you’ve not set a value for the variable that is referenced in the connection script (in the above example, “REPORT”). So what you could do is create a dummy session variable called REPORT with a default value (eg “<unspecified report>”), which will then be used if a report doesn’t override it:

Dummy session variable


Dummy init block

Variables

It may be my misunderstanding of the subtleties of the flavours of OBIEE variables, but the behaviours seem inconsistent to me. For example, even though I am issuing a SET VARIABLE in my logical SQL, the value of the variable REPORT doesn’t change from its default (in this example ‘NONE’) when listed in the Session Manager or queried via Narrative view. It isn’t even shown if I don’t create it as a session variable in the RPD.

Unchanging session variable value

Session variables displayed in Answers

Despite this, the modified value of the variable is what gets passed through correctly in the DB connection.

SAW_SRC_PATH

This is a variable (along with QUERY_SRC_CD) that is passed automagically by Presentation Services to BI Server in the Logical SQL it executes:

Logical SQL, as seen in NQQuery.log

If this could be harnessed and manipulated (eg right-most 63 chars) then the report details of any report could be automatically included with the DB connection string. But – try as I have I can’t access the variable through VALUEOF. Anyone know how?

References

November 3, 2010

Analysing ODI batch performance

Filed under: etl, odi, performance — rmoff @ 21:38

I’ve been involved with some performance work around an ODI DWH load batch. The batch comprises well over 1000 tasks in ODI, and whilst the Operator console is not a bad interface, it’s not very easy to spot the areas consuming the most runtime.

Here’s a set of SQL statements to run against the ODI work repository tables to help you methodically find the steps of most interest for tuning efforts.

odi_04.sql — Session runtimes, including child sessions

First off is the most fancy – using hierarchical SQL, it returns all sessions and child sessions:

-- odi_04.sql
-- 
-- ODI sessions and child sessions - runtimes
-- 
-- https://rnm1978.wordpress.com/
--

select --level,
	--, parent_sess_no 
    sess_no,  
  --Following column can be included if you want to see the root parent session name
	--CONNECT_BY_ROOT sess_name "Root session",
  --
  -- Remove the lpad if you don't want child sessions indented in the results
	lpad('> ',3*(level-1),'-') || sess_name "Name",
	TO_CHAR(SESS_BEG,'yyyy-mm-dd hh24:mi:ss') as "Session Start",
	TO_CHAR(SESS_END,'yyyy-mm-dd hh24:mi:ss') as "Session End",
	SESS_DUR,
	SESS_STATUS
from SNP_SESSION 
-- You can determine how many levels to navigate: level 1 is the master sessions and no children, level 2 is the first layer of children, etc.
--where level <= 3
start with 	    parent_sess_no is null 
-- Use a mixture of the following predicates to identify your batch within the ODI Work Repository, and/or part of the batch of interest
--              and sess_name like '%LOAD%'
--		          and sess_status = 'D' 
		          and sess_beg between to_date('1/11/2010 09:00','DD/MM/YYYY HH24:MI') and to_date('4/11/2010 18:00','DD/MM/YYYY HH24:MI')
connect by prior sess_no 	= parent_sess_no
/

This would return something similar to this:

Example output from odi_04

It’s worth noting a couple of things:

  • “D” status means “Done”. There’s a table in the ODI repository that decodes statuses, although they’re normally obvious
  • Seconds is the total for the session, including child sessions. So in the example shown, “LOAD_FACT1_TRANS_BATCH” takes a total of 4510 seconds, which is comprised of tasks within the session (see below), plus the runtime of LOAD_FACT1_STUFF (64 seconds) and LOAD_FACT1_SALES (4443 seconds).

From this example, there are plenty of long-running steps, so let’s pick one I prepared earlier, session number 984170, “LOAD_FACT1_SALES”, which is a child session of “LOAD_FACT1_TRANS_BATCH” (session number 980170).

odi_06.sql — Session runtime, broken down by step

Using the session number determined by our analysis of the overall batch session runtimes, here’s a query to show the runtime for each step in the session. It is possible to combine this with the hierarchical SQL of above, but I personally found it resulted in too much data to sift though as well as increasing the chances of random stabbing at big numbers. By picking a session from the first query for deliberate further analysis the mind is focussed on it.

-- odi_06.sql
-- 
-- ODI session broken down by step, for a single session
-- 
-- https://rnm1978.wordpress.com/
--
 
select  s.sess_no "Session #",
	sl.nno as "Step Number",
	sess_name "Session Name",
	ss.step_name "Step Name",
  to_char(sl.step_beg,'yyyy-mm-dd hh24:mi:ss') "Step Start",
  to_char(sl.step_end,'yyyy-mm-dd hh24:mi:ss') "Step End",
	sl.step_dur "Step Dur (s)",
from SNP_SESSION S
	left outer join snp_sess_step ss
	on s.sess_no = ss.sess_no
	inner join SNP_STEP_LOG SL
	on ss.sess_no = sl.sess_no
	and ss.nno = sl.nno
where   s.sess_no = 984170
;

For our example session it would give us output something like this:

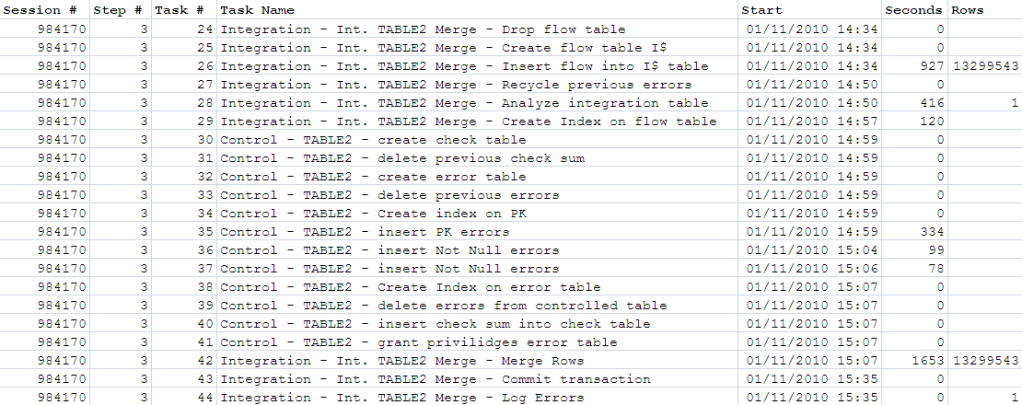
Example output from odi_06.sql

So now we can see that of a long-running load step, over 80% of the time is spent on the step “Int. Table2 Merge”, step number 3

odi_07.sql — Session runtime, broken down task, for a given step

Using the same session number as before, and step number 3 as identified above, let’s have a look at the individual tasks:

-- odi_07.sql
-- 
-- ODI session broken down by task, for a given session and step
-- 
-- https://rnm1978.wordpress.com/
--
 
select  s.sess_no as "Session #",
  sl.nno as "Step #",
	st.scen_task_no as "Task #",
	st.task_name1 || ' - ' || st.task_name2 || ' - ' || st.task_name3 "Task",
  to_char(stl.task_beg,'yyyy-mm-dd hh24:mi:ss') "Task Start",
	stl.task_dur,
	stl.nb_row
from SNP_SESSION S
	left outer join snp_sess_step ss
	on s.sess_no = ss.sess_no
	inner join SNP_STEP_LOG SL
	on ss.sess_no = sl.sess_no
	and ss.nno = sl.nno
	inner join SNP_SESS_TASK ST
	on SS.sess_no = st.sess_no
	and ss.nno = st.nno
	inner join SNP_SESS_TASK_LOG STL
	ON SL.SESS_NO = STL.SESS_NO
	and SL.nno = STL.nno
	and SL.nb_run = STL.nb_run
	and st.scen_task_no = stl.scen_task_no
where   s.sess_no = 984170 
    and sl.nno = 3
;

Example output from odi_07.sql

So from here I’d be focussing on two things:

  • Of the long-running tasks, can they be tuned?
  • Is this whole step using the most efficient logic? Could some of the tasks be combined or removed entirely? Could the load be done in a better way?

More funky stuff

odi_08.sql – Identify task optimisation candidates

At first glance this is a quick-win for listing out the longest running tasks within a batch. And it is that. But, beware of taking a blinkered view of tasks in isolation. The advantage of using the queries above to drill down from overall batch runtime down through sessions, steps, and then to tasks, is that you have the context of the task. Still, this query that follows can be useful for a quick hit list of tasks to check that have been covered off by more detailed analysis.

-- odi_08.sql
-- 
-- ODI task optimisation candidates
-- 
-- https://rnm1978.wordpress.com/
--

select DISTINCT 
      --level
  st.task_name1 || ' - ' || st.task_name2 || ' - ' || st.task_name3 "Task",
 	stl.task_dur,
  stl.nb_row,
  s.sess_no || '/' ||  sl.nno || '/' || stl.scen_task_no as "Session/Step/Task #",  
  SYS_CONNECT_BY_PATH(s.sess_name, ' / ') || ' / ' ||	ss.step_name "Step Name"
from SNP_SESSION S
	left outer join snp_sess_step ss
	on s.sess_no = ss.sess_no
	inner join SNP_STEP_LOG SL
	on ss.sess_no = sl.sess_no
	and ss.nno = sl.nno
	inner join SNP_SESS_TASK ST
	on SS.sess_no = st.sess_no
	and ss.nno = st.nno
	inner join SNP_SESS_TASK_LOG STL
	ON SL.SESS_NO = STL.SESS_NO
	and SL.nno = STL.nno
	and SL.nb_run = STL.nb_run
	and st.scen_task_no = stl.scen_task_no
where stl.task_dur > &&min_duration_secs
and st.task_name3 != 'Run_Subscribed_Process_ID' -- Ignore parent tasks of child sessions
start with 	    parent_sess_no is null 
		and sess_beg between to_date('1/11/2010 09:00','DD/MM/YYYY HH24:MI') and to_date('1/11/2010 18:00','DD/MM/YYYY HH24:MI')
connect by prior s.sess_no 	= s.parent_sess_no
order by stl.task_dur desc
/

Example output from odi_08.sql

As can be seen clearly from this, there are several different types of task within ODI and not all with have a row count associated with them.

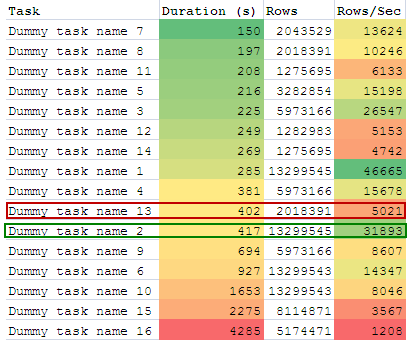
We can start doing more advanced analysis using this data. For example, of the tasks that do return row counts, what rows/sec throughput are we getting? Are there any steps where the throughput is abnormally low, and therefore a candidate for further examination? Dumping the output of odi_08.sql into Excel and adding a derived column rows/sec, and applying Colour Scales Conditional Formatting gives this:

Throughput analysis, using data from odi_08.sql

Looking at this and picking out two tasks that ran for about seven minutes, I’d be a lot more interested in “dummy task 13” which processed just over 2 million rows in that time, compared to “dummy task 2” which processed nearly seven times as many – 13 million. Now it may be one is doing a direct insert and the other’s doing some complicated merge logic, but it’s well worth checking before just heading for the biggest runtime numbers.

October 27, 2010

Two excellent OBI presentations from Jeff McQuigg

Filed under: obiee, performance — rmoff @ 08:59

Jeff McQuigg has posted two presentations that he gave at Openworld 2010 on his website here: http://greatobi.wordpress.com/2010/10/26/oow-presos/

They’re full of real content and well worth a read. There’s excellent levels of detail and plenty to think about if you’re involved in OBI or DW development projects.

September 10, 2010

A fair bite of the CPU pie? Monitoring & Testing Oracle Resource Manager

Filed under: oracle, performance, Resource Manager, unix — rmoff @ 22:35

Introduction

We’re in the process of implemention Resource Manager (RM) on our Oracle 11gR1 Data Warehouse. We’ve currently got one DW application live, but have several more imminent. We identified RM as a suitable way of – as the name would suggest – managing the resources on the server.

In the first instance we’re looking at simply protecting CPU for, and from, future applications. At some point it would be interesting to use some of the more granular and precise functions to demote long-running queries, have nighttime/daytime plans, etc.
I’d also like to explore the management of IO but for us the pain is in bandwidth that a query consumes, and it looks like RM can only work with total session MB, or IOPS. Reading about Exadata it sounds like the Exadata I/O Resource Management might do this ([…]It allows intra and inter-database I/O bandwidth to be defined and managed[..]). But for that I’ll have to write to Santa and promise to be a good boy this year.

Here are some good resources for learning about Resource Manager:

Our implementation of RM

Our initial aim with RM is to do nothing more than ensure that everything we need to run does not do so at the expense of other applications on the server. A 64-way parallel beast of a query should not be allowed to freeze out lightweight workload from application backend processes (such as Usage Tracking, Informatica and DAC Repositories, etc).

We’ve implemented this by grouping schema IDs from the four projects into consumer groups (PROJ_A_GRP, PROJ_B_GRP, PROJ_C_GRP, PROJ_D_GRP). The other group where users are explicitly defined is SYS_GROUP, for the SYS and SYSTEM users. All other users (i.e. those from application backend processes) go in the OTHER_GROUP.

Our Resource Plan is this: CPU priority is allocated entirely to SYSTEM_GROUP. If any is remaining, it is allocated to OTHER_GROUP. Any CPU remaining after that gets divided up in quarters to the four project groups. It’s worth pointing out that Oracle itself manages Oracle core processes, in a group called _ORACLE_BACKGROUND_GROUP_.

Here’s the contents of V$RSRC_PLAN, DBA_RSRC_PLANS, and DBA_RSRC_PLAN_DIRECTIVES for the current active plan:

        ID NAME                             IS_TOP_PLAN CPU_MANAGED
---------- -------------------------------- ----------- -----------
   1020578 DW_PLAN                          TRUE        ON


                       NUM_PLAN                                                                                                                      SUB
  PLAN_ID PLAN       DIRECTIVES CPU_METHOD       MGMT_METHOD      ACTIVE_SESS_POOL_MTH             PARALLEL_DEGREE_LIMIT_MTH        QUEUEING_MTH     PLAN
--------- ---------- ---------- ---------------- ---------------- -------------------------------- -------------------------------- ---------------- ------
  1020578 DW_PLAN             6 EMPHASIS         EMPHASIS         ACTIVE_SESS_POOL_ABSOLUTE        PARALLEL_DEGREE_LIMIT_ABSOLUTE   FIFO_TIMEOUT     NO


PLAN       GROUP_OR_SUBPLAN     TYPE           CPU_P1 CPU_P2 CPU_P3 MGMT_P1 MGMT_P2 MGMT_P3
---------- -------------------- -------------- ------ ------ ------ ------- ------- -------
DW_PLAN    SYS_GROUP            CONSUMER_GROUP    100      0      0     100       0       0
DW_PLAN    OTHER_GROUPS         CONSUMER_GROUP      0    100      0       0     100       0
DW_PLAN    PROJ_A_GRP           CONSUMER_GROUP      0      0     25       0       0      25
DW_PLAN    PROJ_B_GRP           CONSUMER_GROUP      0      0     25       0       0      25
DW_PLAN    PROJ_C_GRP           CONSUMER_GROUP      0      0     25       0       0      25
DW_PLAN    PROJ_D_GRP           CONSUMER_GROUP      0      0     25       0       0      25

My understanding of RM’s control of CPU is that in essence it does nothing, until the database is under CPU pressures. Once queries are being constrained by CPU, RM will enforce the allocation of CPU between the various consumer groups as defined in the currently active Resource Plan.

Note that RM is only within the Oracle context – it cannot do anything about non-Oracle processes on the same server using lots of CPU. An example of this that we’ve seen is ODI agents running local to the database – if these are doing lots of work then they may impact Oracle but we cannot use RM to control it.

Here’s my understanding of how we’ll see RM in action – and as you’ll see from the tests that I run, I’m not sure that it is entirely correct. Generally, there will be no SYSTEM_GROUP activity, and very minimal OTHER_GROUP activity. This leaves the lion’s share for our application queries/ETL. Until the CPU on the box hits 100%, no throttling will be done. This is important to note. Our allocation of 25% CPU to PROJ_A_GRP only means that it is the minimum it can expect (see below – this doesn’t seem to be correct). If nothing else is running, it will get 100%. Conversely, if an application backend process (in the OTHER_GROUP consumer group) is using lots of CPU, let’s say 60%, and all four project groups are demanding CPU, then each will get 25% of the remaining 40% of the box’s capacity, i.e. 10% host CPU.

Scripts to Monitor and Test RM

It’s important to know that RM is doing what we think it is, and to also be able to determine the current state of a system in terms of resources. If a system is at 100% CPU and users are demanding why RM “isn’t working” it will be useful to prove that it is non-Oracle processes creating the CPU demand.

I’ve been working on some queries to both validate and monitor RM. This excellent whitepaper on RM has some queries illustrating how to use v$rsrcmgrmetric_history to report on RM behaviour. I built on this to incorporate V$SYSMETRIC_HISTORY to source host CPU %, creating this query which infers the workload on the system.

We’re looking at system statistics per minute slice (which is the level that v$rsrcmgrmetric_history is at, and then GROUP_ID=2 on V$SYSMETRIC_HISTORY).

The source metrics are :

  • CPU count – From v$osstat where stat_name = 'NUM_CPUS'.
  • Host CPU utilisation (%) – From V$SYSMETRIC_HISTORY where metric_id = 2057. This number should match the CPU usage as reported by the host (e.g. through sar, top, glance etc)
  • Used Oracle Seconds – From V$RSRCMGRMETRIC_HISTORY.cpu_consumed_time. The number of CPU seconds that Oracle thinks it has consumed

From this are derived:

  • Total Available CPU Seconds – The number of CPU seconds per minute slice available is going to be 60 seconds multiplied by the number of CPUs that in theory could be running Oracle work. Obviously in practice Oracle can’t use 100% of this CPU time, but this number’s a useful starting point for the following derivations
  • Total Used Seconds – Total CPU time, divided by the host CPU utilisation. So if the CPU is at 50% utilisation and there are 480 CPU seconds available per minute, then logically 240 CPU seconds must have been used over that minute. Note that this is the total number of CPU seconds used, both Oracle and Non-Oracle.
  • Non-Oracle Seconds Used – Total CPU time, divided by the host CPU utilisation, minus the number of CPU seconds Oracle has used.

From the above derived figures percentages are calculated too.

rm_cpu_01.sql:

/* System CPU and Resource Manager impact over time

Based on : http://www.oracle.com/technetwork/database/features/performance/resource-manager-twp-133705.pdf
and http://download.oracle.com/docs/cd/B28359_01/server.111/b28320/dynviews_3084.htm#I1030344

https://rnm1978.wordpress.com/
*/
set linesize 160
set pagesize 50
set colsep '  ' -- thanks @Boneist 🙂
column "Total Available CPU Seconds"    head "Total Available|CPU Seconds"      format 990
column "Used Oracle Seconds"            head "Used Oracle|Seconds"              format 990.9
column "Used Host CPU %"                head "Used Host|CPU %"                  format 990.9
column "Idle Host CPU %"                head "Idle Host|CPU %"                  format 990.9
column "Total Used Seconds"             head "Total Used|Seconds"               format 990.9
column "Idle Seconds"                   head "Idle|Seconds"                     format 990.9
column "Non-Oracle Seconds Used"        head "Non-Oracle|Seconds Used"          format 990.9
column "Oracle CPU %"                   head "Oracle|CPU %"                     format 990.9
column "Non-Oracle CPU %"               head "Non-Oracle|CPU %"                 format 990.9
column "throttled"                      head "Oracle Throttled|Time (s)"        format 990.9

select to_char(rm.BEGIN_TIME,'YYYY-MM-DD HH24:MI:SS') as BEGIN_TIME
        ,60 * (select value from v$osstat where stat_name = 'NUM_CPUS') as "Total Available CPU Seconds"
        ,sum(rm.cpu_consumed_time) / 1000 as "Used Oracle Seconds"
        ,min(s.value) as "Used Host CPU %"
        ,(60 * (select value from v$osstat where stat_name = 'NUM_CPUS')) * (min(s.value) / 100) as "Total Used Seconds"
        ,((100 - min(s.value)) / 100) * (60 * (select value from v$osstat where stat_name = 'NUM_CPUS')) as "Idle Seconds"
        ,((60 * (select value from v$osstat where stat_name = 'NUM_CPUS')) * (min(s.value) / 100)) - sum(rm.cpu_consumed_time) / 1000 as "Non-Oracle Seconds
Used"
        ,100 - min(s.value) as "Idle Host CPU %"
        ,((((60 * (select value from v$osstat where stat_name = 'NUM_CPUS')) * (min(s.value) / 100)) - sum(rm.cpu_consumed_time) / 1000) / (60 * (select valu
e from v$osstat where stat_name = 'NUM_CPUS')))*100 as "Non-Oracle CPU %"
        ,(((sum(rm.cpu_consumed_time) / 1000) / (60 * (select value from v$osstat where stat_name = 'NUM_CPUS'))) * 100) as "Oracle CPU %"
        , sum(rm.cpu_wait_time) / 1000 as throttled
from    gv$rsrcmgrmetric_history rm
        inner join
        gV$SYSMETRIC_HISTORY s
        on rm.begin_time = s.begin_time
where   s.metric_id = 2057
  and   s.group_id = 2
group by rm.begin_time,s.begin_time
order by rm.begin_time
/

This is my server when Oracle is at rest:

                     Total Available  Used Oracle  Used Host  Total Used     Idle    Non-Oracle  Idle Host  Non-Oracle  Oracle  Oracle Throttled
BEGIN_TIME               CPU Seconds      Seconds      CPU %     Seconds  Seconds  Seconds Used      CPU %       CPU %   CPU %          Time (s)
-------------------  ---------------  -----------  ---------  ----------  -------  ------------  ---------  ----------  ------  ----------------
2010-09-10 14:45:51              480          3.0        1.8         8.4    471.6           5.4       98.2         1.1     0.6               0.0
2010-09-10 14:46:50              480          3.0        1.7         8.0    472.0           5.0       98.3         1.0     0.6               0.0
2010-09-10 14:47:50              480          3.4        3.9        18.6    461.4          15.2       96.1         3.2     0.7               0.0
2010-09-10 14:48:50              480          0.7        2.1        10.1    469.9           9.4       97.9         2.0     0.1               0.0
2010-09-10 14:49:50              480          0.3        1.3         6.3    473.7           6.0       98.7         1.2     0.1               0.0
2010-09-10 14:50:51              480          0.2        2.2        10.8    469.2          10.6       97.8         2.2     0.0               0.0

N.B. at high CPU usage I’ve seen errors appear in the derived numbers, with negative values for non-oracle time and percentage. I’d speculate that this is because we’re dealing with percentage (CPU) figures averaged out over a minute, but cumulative figures (used Oracle seconds) over the same period.

The CPU figure is validated by output from sar (give or take a percentage point):

HP-UX myserver B.11.31 U ia64    09/10/10

14:45:47    %usr    %sys    %wio   %idle
14:46:47       1       1       0      98
14:47:47       1       1       0      98
14:48:47       3       1       0      96
14:49:47       1       1       0      98
14:50:47       1       1       0      98

CPU usage by consumer group can be examined in more detail using this script, rm_05.sql:

/* CPU usage and RM impact over time, by consumer group, per minute

Derived from : http://www.oracle.com/technetwork/database/features/performance/resource-manager-twp-133705.pdf

https://rnm1978.wordpress.com
*/

set linesize 160
set pagesize 60
set colsep '  '

column total                    head "Total Available|CPU Seconds"      format 990
column consumed                 head "Used|Oracle Seconds"              format 990.9
column consumer_group_name      head "Consumer|Group Name"              format a25      wrap off
column "throttled"              head "Oracle Throttled|Time (s)"        format 990.9
column cpu_utilization          head "% of Host CPU" 	                format 990.9
break on time skip 2 page

select to_char(begin_time, 'YYYY-DD-MM HH24:MI:SS') time,
consumer_group_name,
60 * (select value from v$osstat where stat_name = 'NUM_CPUS') as total,
cpu_consumed_time / 1000 as consumed,
cpu_consumed_time / (select value from v$parameter where name = 'cpu_count') / 600 as cpu_utilization,
cpu_wait_time / 1000 as throttled
from v$rsrcmgrmetric_history
order by begin_time,consumer_group_name
/
                                                     Total Available            Used                      Oracle Throttled
TIME                 CONSUMER_GROUP_NAME                 CPU Seconds  Oracle Seconds  % of Host CPU          Time (s)
-------------------  ------------------------------  ---------------  --------------  ------------------  ----------------
2010-10-09 14:37:50  PROJ_C_GRP                                  480            40.4                 8.4               0.0
                     PROJ_A_GRP                                  480             0.0                 0.0               0.0
                     PROJ_B_GRP                                  480             0.0                 0.0               0.0
                     OTHER_GROUPS                                480             5.0                 1.0               0.0
                     PROJ_D_GRP                                  480             0.0                 0.0               0.0
                     SYS_GROUP                                   480             0.0                 0.0               0.0
                     _ORACLE_BACKGROUND_GROUP_                   480             0.0                 0.0               0.0

For details of each session within a consumer group I use script rm_02.sql:

/*
Resource Manager / Session details

 V$RSRC_SESSION_INFO
    http://download.oracle.com/docs/cd/B28359_01/server.111/b28320/dynviews_2153.htm#REFRN30404

https://rnm1978.wordpress.com
*/
SET pagesize 50
SET linesize 155
SET wrap off
COLUMN name format a11 head "Consumer|Group"
COLUMN sid format 9999
COLUMN username format a16
COLUMN CONSUMED_CPU_TIME head "Consumed|CPU time|(s)" format 999999.9
COLUMN IO_SERVICE_TIME head "I/O time|(s)" format 9999.9
COLUMN CPU_WAIT_TIME head "CPU Wait|Time (s)" FOR 99999
COLUMN CPU_WAITS head "CPU|Waits" format 99999
COLUMN YIELDS head "Yields" format 99999
COLUMN state format a10
COLUMN osuser format a8
COLUMN machine format a16
COLUMN PROGRAM format a12

SELECT
          rcg.name
        , rsi.sid
        , s.username
        , rsi.state
        , rsi.YIELDS
        , rsi.CPU_WAIT_TIME / 1000 AS CPU_WAIT_TIME
        , rsi.CPU_WAITS
        , rsi.CONSUMED_CPU_TIME / 1000 AS CONSUMED_CPU_TIME
        , rsi.IO_SERVICE_TIME /1000 AS IO_SERVICE_TIME
        , s.osuser
        , s.program
        , s.machine
        , sw.event
FROM V$RSRC_SESSION_INFO rsi INNER JOIN v$rsrc_consumer_group rcg
ON rsi.CURRENT_CONSUMER_GROUP_ID = rcg.id
INNER JOIN v$session s ON rsi.sid=s.sid
INNER JOIN v$session_wait sw ON s.sid = sw.sid
WHERE rcg.id !=0 -- _ORACLE_BACKGROUND_GROUP_
and (sw.event != 'SQL*Net message from client' or rsi.state='RUNNING')
ORDER BY rcg.name, s.username,rsi.cpu_wait_time + rsi.IO_SERVICE_TIME + rsi.CONSUMED_CPU_TIME ASC, rsi.state, sw.event, s.username, rcg.name,s.machine,s.osuser
/

N.B. When quoting the output from this query I cut sessions such as the one running the query itself, and other non-relevant processes (eg non-active monitoring etc):

                                                                      Consumed
Consumer                                             CPU Wait    CPU  CPU time I/O time
Group         SID USERNAME         STATE      Yields Time (s)  Waits       (s)      (s) OSUSER   PROGRAM      MACHINE          EVENT
----------- ----- ---------------- ---------- ------ -------- ------ --------- -------- -------- ------------ ---------------- ----------------------------
PROJ_A_GRP   1089 PROJA_USR       RUNNING        53        3     53     426.0       .0 myuser0 sqlplus@aser aserver          resmgr:cpu quantum
PROJ_B_GRP    523 PROJB_USR       RUNNING       284       17    284     412.4       .0 myuser0 sqlplus@aser aserver          latch free
PROJ_B_GRP    508 PROJB_USR       RUNNING       272       18    272     410.7       .0 myuser0 sqlplus@aser aserver          latch free
PROJ_B_GRP   1090 PROJB_USR       RUNNING        52        3     52     426.0       .0 myuser0 sqlplus@aser aserver          latch free

To generate load on the database I’ve got a script, hit_cpu.sql, that is based on one provided by one of our DBAs:

/* Generate CPU load

Based on http://jhdba.wordpress.com/2009/11/19/maxing-out-cpus-script/

https://rnm1978.wordpress.com
*/

set timing on

select to_char(sysdate,'YYYY-MM-DD HH24:MI:SS') as start_time from dual

/
declare a number := 1;
begin for i in 1..1000000000
loop a := ( a + i )/11;
end loop;
end;
/
select to_char(sysdate,'YYYY-MM-DD HH24:MI:SS') as end_time from dual;
/

Test 01

I started the hit_cpu script at 15:38:32. You can see its impact :

                     Total Available  Used Oracle  Used Host  Oracle Throttled
BEGIN_TIME               CPU Seconds      Seconds      CPU %          Time (s)
-------------------  ---------------  -----------  ---------  ----------------
2010-09-10 15:37:50              480         17.8        5.7               0.0
2010-09-10 15:38:50              480         58.5       14.3               0.0
2010-09-10 15:39:50              480         59.5       14.3               0.0
2010-09-10 15:40:50              480         60.3       15.3               0.0
2010-09-10 15:41:50              480         58.3       15.4               0.0
2010-09-10 15:42:50              480         59.3       14.7               0.0
2010-09-10 15:43:50              480         58.4       13.9               0.0
2010-09-10 15:44:50              480         59.3       14.3               0.0
2010-09-10 15:45:50              480         58.6       13.8               0.0
2010-09-10 15:46:50              480         58.4       14.0               0.0
2010-09-10 15:47:50              480         31.8       10.0               0.0
2010-09-10 15:48:50              480          0.1        1.3               0.0

(for the purposes of this article the derived measures are a distraction, and possibly inaccurate too, so I’ve omitted them from here on)

Very satisfyingly, for each 60-second slice Oracle is using just under 60 seconds of CPU – i.e. my script is loading one CPU.

                                                     Total Available            Used                      Oracle Throttled
TIME                 CONSUMER_GROUP_NAME                 CPU Seconds  Oracle Seconds  % of Host CPU          Time (s)
-------------------  ------------------------------  ---------------  --------------  ------------------  ----------------
2010-10-09 15:38:50  PROJ_C_GRP                                  480             0.0                 0.0               0.0
                     PROJ_A_GRP                                  480             0.0                 0.0               0.0
                     PROJ_B_GRP                                  480             0.0                 0.0               0.0
                     OTHER_GROUPS                                480            58.5                12.2               0.0
                     PROJ_D_GRP                                  480             0.0                 0.0               0.0
                     SYS_GROUP                                   480             0.0                 0.0               0.0
                     _ORACLE_BACKGROUND_GROUP_                   480             0.0                 0.0               0.0

sar matches up with the CPU figures from Oracle:

            %usr    %sys    %wio   %idle
15:38:47       4       1       0      95
15:39:47      14       1       0      85
15:40:47      14       1       0      85
15:41:47      14       1       0      84
15:42:47      15       1       0      84
15:43:47      14       1       0      85
15:44:47      14       1       0      86
15:45:47      14       1       0      85
15:46:47      14       1       0      86
15:47:47      14       1       0      86
15:48:47      10       1       0      89
15:49:47       1       1       0      98

Test 02

I added two more scripts into the test, initiating them from a shell script using the ampersand operator to create them as background jobs running in parallel:

/app/oracle/product/11.1.0/db_1/bin/sqlplus USER/PW @hit_cpu &

(The sqlplus path is specified because I’ve got an alias for ‘sqlplus’ to use ied, and it doesn’t like running concurrently from the same shell)

The scripts started at 2010-09-10 15:57:54. Monitoring showed three CPUs being utilised (“Used Oracle Seconds” – c.178 seconds = 3 x c.60 seconds) by Oracle:

                     Total Available  Used Oracle  Used Host  
BEGIN_TIME               CPU Seconds      Seconds      CPU %  
-------------------  ---------------  -----------  ---------  
2010-09-10 15:56:50              480          0.8        1.6  
2010-09-10 15:57:50              480        156.9        3.5  
2010-09-10 15:58:50              480        175.1        1.8  
2010-09-10 15:59:50              480        190.9       11.1  
2010-09-10 16:00:50              480        177.8        4.2  
2010-09-10 16:01:51              480        174.9        2.8  
2010-09-10 16:02:50              480        175.3        3.8  
2010-09-10 16:03:50              480        185.8        5.9  
2010-09-10 16:04:50              480        174.9        2.4  
2010-09-10 16:05:50              480        175.2        6.8  
2010-09-10 16:06:50              480        174.1        2.4  
2010-09-10 16:07:50              480          4.9        2.2  

However notice the “Used Host CPU %” value – a very low value, and not matching with sar for the same period:

            %usr    %sys    %wio   %idle
15:57:47       1       1       0      97
15:58:47      33       1       0      65
15:59:47      39       1       0      60
16:00:47      45       1       0      54
16:01:47      40       1       0      59
16:02:47      40       1       0      60
16:03:47      40       1       0      59
16:04:47      41       1       0      57
16:05:47      39       1       0      60
16:06:47      41       2       0      57
16:07:47      39       1       0      60
16:08:47       4       1       0      95

I can’t explain (explanations welcome!) why V$SYSMETRIC_HISTORY is [apparently] incorrect for this period.

I re-ran the test and Host CPU was picked up correctly by Oracle. The results on the second run matched the first:

                     Total Available  Used Oracle  Used Host  
BEGIN_TIME               CPU Seconds      Seconds      CPU %  
-------------------  ---------------  -----------  ---------  
2010-09-10 21:52:50              480          0.1        1.6       
2010-09-10 21:53:50              480          0.2        1.3       
2010-09-10 21:54:50              480        140.2       32.6       
2010-09-10 21:55:50              480        177.9       41.1       
2010-09-10 21:56:50              480        174.9       42.1       
2010-09-10 21:57:50              480        177.6       40.4       
2010-09-10 21:58:50              480        174.8       39.6       
2010-09-10 21:59:50              480        189.0       43.0       
2010-09-10 22:00:50              480        177.7       40.0       
2010-09-10 22:01:50              480        174.5       42.2       
2010-09-10 22:02:50              480        178.0       40.8       
2010-09-10 22:03:51              480        180.8       41.3       
2010-09-10 22:04:50              480         12.3        4.0       
2010-09-10 22:05:50              480          0.1        1.7       
2010-09-10 22:06:50              480          0.2        1.8       

Test 03

The next test I ran used the hit_cpu script and was called once from a user in one each of the four consumer groups, plus a user not allocated a consumer group and therefore in OTHER_GROUP. Five scripts in total, so should expect to see CPU usage around (5 x c.60) = c.300 seconds, and machine CPU at something like (5/8)*100 so c.60-70%

Test started at 2010-09-10 16:20:20. CPU immediately hit about 64% – which based on my calculation above was satisfying 🙂

Using rm_05 (see above), the breakdown of Oracle CPU time could be seen:

                                                     Total Available            Used                      Oracle Throttled
TIME                 CONSUMER_GROUP_NAME                 CPU Seconds  Oracle Seconds  % of Host CPU          Time (s)
-------------------  ------------------------------  ---------------  --------------  ------------------  ----------------
2010-10-09 16:20:50  PROJ_C_GRP                                  480            58.2                12.1               0.0
                     PROJ_A_GRP                                  480            58.2                12.1               0.0
                     PROJ_B_GRP                                  480            58.2                12.1               0.0
                     OTHER_GROUPS                                480            58.8                12.3               0.0
                     PROJ_D_GRP                                  480            58.4                12.2               0.0
                     SYS_GROUP                                   480             0.0                 0.0               0.0
                     _ORACLE_BACKGROUND_GROUP_                   480             0.0                 0.0               0.0

rm_cpu_01 showed Oracle using c.290 CPU seconds per minute (again inline with estimate – yeah!), and this time the Host CPU % looked accurate:

                     Total Available  Used Oracle  Used Host  Oracle Throttled
BEGIN_TIME               CPU Seconds      Seconds      CPU %          Time (s)
-------------------  ---------------  -----------  ---------  ----------------
2010-09-10 16:20:50              480        291.9       66.1               0.0
2010-09-10 16:21:50              480        291.5       65.0               0.0

sar matched up :

            %usr    %sys    %wio   %idle
16:21:47      65       2       0      34
16:22:47      64       1       0      35

(note that sar’s timestamp is the END of a sample, whereas the BEGIN_TIME in my Oracle queries is the BEGINNING of a sample)

Test 04

Having seen that RM is correctly assigning our different users to the appropriate consumer groups, we can start testing how RM behaves once the host CPU hits capacity and RM has to start throttling its allocation to the groups.

In theory eight instances of the script should be enough to load the CPU entirely (since there are eight CPUs on the server). I ran four as a user from PROJ_B_GRP and four from PROJ_A_GRP, starting at 2010-09-10 18:27:53

As predicated CPU usage hits about 100%, according to sar:

            %usr    %sys    %wio   %idle
18:27:38       2       1       0      97
18:28:38      69       2       0      29
18:29:38      92       1       0       7
18:30:38      99       1       0       0
18:31:38      96       1       0       3
18:32:38      99       1       0       0
18:33:38      96       1       0       3

and this is reflected by Oracle too (rm_cpu_01):

                     Total Available  Used Oracle  Used Host  Oracle Throttled
BEGIN_TIME               CPU Seconds      Seconds      CPU %          Time (s)
-------------------  ---------------  -----------  ---------  ----------------
2010-09-10 18:26:50              480          1.0        2.3               0.0
2010-09-10 18:27:51              480        444.2       89.5               8.8
2010-09-10 18:28:50              480        472.9       95.0               0.0
2010-09-10 18:29:50              480        465.5       99.1               5.5
2010-09-10 18:30:50              480        462.1       97.0              32.2
2010-09-10 18:31:49              480        473.6      100.0               0.1
2010-09-10 18:32:50              480        458.5       95.2              24.7

We can see that of the 480 CPU seconds available in every minute slice, Oracle is using almost all of it – around 470 seconds.

Looking at Resource Manager, we can see that it kicks in – in the time slice beginning at 18:30:50, Oracle constrained one or some of the queries by a total of 30 seconds. Using rm_02 we can see how this divides up among the sessions. “CPU Wait Time (s)” corresponds to the “Oracle Throttled Time (s)” in rm_cpu_01 and rm_05(bearing in mind different levels of granularity since one is per minute / consumer group and one is per session total).

Consumer                                             CPU Wait    CPU  CPU time I/O time
Group         SID USERNAME         STATE      Yields Time (s)  Waits       (s)      (s) OSUSER   PROGRAM      MACHINE          EVENT
----------- ----- ---------------- ---------- ------ -------- ------ --------- -------- -------- ------------ ---------------- ----------------------------
PROJ_A_GRP   1094 PROJA_USR       RUNNING        61        2     61     960.5       .0 myuser0 sqlplus@aser aserver          resmgr:cpu quantum
PROJ_A_GRP    553 PROJA_USR       RUNNING       302       16    302     946.8       .0 myuser0 sqlplus@aser aserver          latch free
PROJ_A_GRP    498 PROJA_USR       RUNNING       310       19    310     945.2       .0 myuser0 sqlplus@aser aserver          latch free
PROJ_A_GRP   1089 PROJA_USR       RUNNING        61        3     61     960.5       .0 myuser0 sqlplus@aser aserver          resmgr:cpu quantum
PROJ_B_GRP   1078 PROJB_USR       RUNNING        56        4     56     959.5       .0 myuser0 sqlplus@aser aserver          latch free
PROJ_B_GRP    523 PROJB_USR       RUNNING       301       17    301     946.7       .0 myuser0 sqlplus@aser aserver          latch free
PROJ_B_GRP    508 PROJB_USR       RUNNING       290       19    290     945.1       .0 myuser0 sqlplus@aser aserver          latch free
PROJ_B_GRP   1090 PROJB_USR       RUNNING        61        3     61     960.4       .0 myuser0 sqlplus@aser aserver          latch free

and aggregated to consumer group level (script rm_05):

                                                     Total Available            Used                      Oracle Throttled
TIME                 CONSUMER_GROUP_NAME                 CPU Seconds  Oracle Seconds  % of Host CPU          Time (s)
-------------------  ------------------------------  ---------------  --------------  ------------------  ----------------
2010-10-09 18:30:50  PROJ_C_GRP                                  480             0.0                 0.0               0.0
                     PROJ_A_GRP                                  480           217.7                45.4              13.1
                     PROJ_B_GRP                                  480           215.8                45.0              15.0
                     OTHER_GROUPS                                480            28.6                 6.0               4.1
                     PROJ_D_GRP                                  480             0.0                 0.0               0.0
                     SYS_GROUP                                   480             0.0                 0.0               0.0
                     _ORACLE_BACKGROUND_GROUP_                   480             0.0                 0.0               0.0

Note that the throttling is applied pretty much equally to both consumer groups. In plan terms, CPU for level 1 (100% to SYS_GROUP) is unused, so passes to level 2 (100% to OTHER_GROUP). OTHER_GROUP consumes a small amount, and note that it is not [really] throttled. The remaining CPU (96%, from rm_cpu_01, minus 6% shown in rm_05 output = c.90%), is passed onto level 3 of the plan. Whilst the four projects are defined an allocation of 25% each in the plan, two of the consumer groups are not consuming their chunk, so it is divided up amongst the groups that are, according to the ratio of their allocations. Hence, PROJ_A_GRP and PROJ_B_GRP are using c.45% of host CPU.
N.B. see below for discussion around allocation of CPU, as this statement about ratio may not be true.

Test 05

Test 04 above showed that RM applies throttling evenly to consumer groups, but it could have been influenced by an equal number of sessions for each consumer group running (that is, if it had throttled in a round-robin manner the result could have been the same).

This test will run a similar workload, but with a skewed number of sessions; 1 PROJ_A_GRP and 7 PROJ_B_GRP.

The test began at 2010-09-10 19:03:22.

Total CPU usage is about 84%, which on an eight-CPU box is c.1 CPU unused. Script rm_cpu_01 shows:

                     Total Available  Used Oracle  Used Host  Oracle Throttled
BEGIN_TIME               CPU Seconds      Seconds      CPU %          Time (s)
-------------------  ---------------  -----------  ---------  ----------------
2010-09-10 19:00:51              480          0.2        3.9               0.0
2010-09-10 19:01:50              480          0.2        1.4               0.0
2010-09-10 19:02:51              480        182.9       41.7              37.8
2010-09-10 19:03:50              480        398.5       85.0              83.0
2010-09-10 19:04:51              480        383.1       83.2              82.4
2010-09-10 19:05:50              480        388.7       83.4              83.7
2010-09-10 19:06:51              480        388.0       84.8              80.8
2010-09-10 19:07:51              480        386.8       84.7              81.0
2010-09-10 19:08:50              480        383.4       83.1              83.4
2010-09-10 19:09:50              480        388.4       83.7              79.2
2010-09-10 19:10:50              480        383.0       83.4              85.4
2010-09-10 19:11:50              480        390.6       83.5              85.4
2010-09-10 19:12:51              480        378.7       85.3              83.1
2010-09-10 19:13:50              480        392.5       83.4              81.1
2010-09-10 19:14:51              480        384.9       82.9              82.9
2010-09-10 19:15:50              480        373.0       81.1              79.8
2010-09-10 19:16:50              480        303.3       67.1              66.2
2010-09-10 19:17:50              480        293.9       65.8              59.2
2010-09-10 19:18:50              480        293.7       66.7              59.0
2010-09-10 19:19:50              480        242.4       55.0              58.3
2010-09-10 19:20:50              480        237.2       53.8              59.3
2010-09-10 19:21:51              480        233.1       53.0              58.4
2010-09-10 19:22:50              480        219.7       50.5              48.8
2010-09-10 19:23:50              480          0.8        1.6               0.0

This breaks down according to rm_05 into:

                                                     Total Available            Used                 Oracle Throttled
TIME                 CONSUMER_GROUP_NAME                 CPU Seconds  Oracle Seconds  % of Host CPU          Time (s)
-------------------  ------------------------------  ---------------  --------------  -------------  ----------------
2010-10-09 19:13:50  PROJ_C_GRP                                  480             0.0            0.0               0.0
                     PROJ_A_GRP                                  480            59.2           12.3               0.0
                     PROJ_B_GRP                                  480           333.2           69.4              81.1
                     OTHER_GROUPS                                480             0.1            0.0               0.0
                     PROJ_D_GRP                                  480             0.0            0.0               0.0
                     SYS_GROUP                                   480             0.0            0.0               0.0
                     _ORACLE_BACKGROUND_GROUP_                   480             0.0            0.0               0.0

(all the minute time slices have same approximate CPU / seconds values)

rm_02 shows the individual sessions:

                                                                             Consumed
Consumer                                                  CPU Wait     CPU   CPU time  I/O time
Group          SID  USERNAME          STATE       Yields  Time (s)   Waits        (s)       (s)  PROGRAM       EVENT
-----------  -----  ----------------  ----------  ------  --------  ------  ---------  --------  ------------  --------------------------------------------
PROJ_A_GRP     521  PROJA_USR        RUNNING          2         0       2      766.9        .0  sqlplus@aser  resmgr:cpu quantum
PROJ_B_GRP    1084  PROJB_USR        RUNNING       5385       225    5385      574.0        .0  sqlplus@aser  resmgr:cpu quantum
PROJ_B_GRP    1082  PROJB_USR        RUNNING       5416       228    5416      571.1        .0  sqlplus@aser  resmgr:cpu quantum
PROJ_B_GRP    1098  PROJB_USR        WAITING FO    5373       224    5373      575.3        .0  sqlplus@aser  resmgr:cpu quantum
PROJ_B_GRP    1070  PROJB_USR        RUNNING       5405       224    5405      575.0        .0  sqlplus@aser  resmgr:cpu quantum
PROJ_B_GRP    1075  PROJB_USR        RUNNING       5424       222    5424      577.3        .0  sqlplus@aser  resmgr:cpu quantum
PROJ_B_GRP     498  PROJB_USR        RUNNING          0         0       0      799.7        .0  sqlplus@aser  latch free
PROJ_B_GRP     508  PROJB_USR        RUNNING          1         0       1      799.7        .0  sqlplus@aser  resmgr:internal state change
OTHER_GROUP    491  myuser0          RUNNING          0         0       1         .4        .0  sqlplus@aser  SQL*Net message to client

So – PROJ_A_GRP is getting all the CPU that it needs (since it is shown as having zero CPU Wait Time (rm_02) and zero throttled time (rm_05). The session is also shown (in rm_05) as consuming almost 60 CPU seconds in a 60 second time slice.

The PROJ_B_GRP has two sessions that apparently run unconstrained, and five that are throttled by RM. The output from rm_cpu_01 above shows that RM throttles the queries by roughly 80 seconds of CPU time per minute. Over five sessions (and rm_02 above shows the constraining being applied equally) that equates to c.16 seconds of CPU time per session.

Even once the first queries complete c.19:17 and the CPU usage drops further, RM still appears to throttle the PROJ_B_GRP queries.

So here is my first major puzzlement with RM:

  • I would have expected to see all seven PROJ_B_GRP sessions constrained at the same rate.
  • Why were the PROJ_B_GRP queries throttled even when there was idle CPU? From 19:17 onwards there was around 35% idle.

FWIW the scripts were started from a shell script similar to above, with the PROJ_B_GRP sessions first, and then PROJ_A_GRP session.

Test 06

In Test 05 PROJ_A_GRP was running only one process, so would not be demanding as much or more than its theoretical 25% allocation. This test will run three PROJ_A_GRP sessions and which would (based on Test 02 above) require c.36% host CPU to run. In addition I will run six PROJ_B_GRP sessions, theoretical CPU requirement of c.72% host CPU. The total CPU should be driven above 100% and RM kick in.

My understanding (which could be wrong) of RM is that it will do as it did above when there were equal numbers of sessions in each consumer group to throttle; it will allocate the resource 50:50 to the two consumer groups, even though the ratio of sessions will be 1:2.

The test started at 2010-09-10 19:43:51. The results were different from what I had expected.

CPU didn’t hit 100%, staying around 85%. Overall it looked like this (rm_cpu_01):

                     Total Available  Used Oracle  Used Host  Oracle Throttled
BEGIN_TIME               CPU Seconds      Seconds      CPU %          Time (s)
-------------------  ---------------  -----------  ---------  ----------------
2010-09-10 19:40:50              480          0.4        0.9               0.0
2010-09-10 19:41:50              480          0.2        1.1               0.0
2010-09-10 19:42:50              480          2.5        3.8               0.1
2010-09-10 19:43:51              480        424.7       85.5             101.6
2010-09-10 19:44:50              480        420.0       84.4             101.3
2010-09-10 19:45:50              480        422.6       84.1             105.7
2010-09-10 19:46:50              480        423.4       84.0             106.7
2010-09-10 19:47:50              480        425.3       83.2             107.4

sar reports pretty much the same cpu (the figure of 68% here is because of the time at which the test started versus the point in the minute at which sar is recording from):

            %usr    %sys    %wio   %idle
19:41:38       1       1       0      99
19:42:38       1       1       0      98
19:43:38       1       1       0      98
19:44:38      68       1       0      31
19:45:38      85       1       0      14
19:46:38      84       1       0      15
19:47:38      83       1       0      17
19:48:38      83       1       0      16

RM throttled both consumer groups – but by a different amount to what I had expected. Taking a minute slice (and all were almost the same) using rm_05:

                                                     Total Available            Used                 Oracle Throttled
TIME                 CONSUMER_GROUP_NAME                 CPU Seconds  Oracle Seconds  % of Host CPU          Time (s)
-------------------  ------------------------------  ---------------  --------------  -------------  ----------------
2010-10-09 19:44:50  PROJ_C_GRP                                  480             0.0            0.0               0.0
                     PROJ_A_GRP                                  480           135.2           28.2              38.4
                     PROJ_B_GRP                                  480           284.7           59.3              62.8
                     OTHER_GROUPS                                480             0.1            0.0               0.2
                     PROJ_D_GRP                                  480             0.0            0.0               0.0
                     SYS_GROUP                                   480             0.0            0.0               0.0
                     _ORACLE_BACKGROUND_GROUP_                   480             0.0            0.0               0.0

So RM appears to guarenteeing PROJ_A_GRP at least 25% CPU (per the resource plan), but after than it allocates twice as much CPU to PROJ_B_GRP

Individual sessions (rm_02):

                                                                             Consumed
Consumer                                                  CPU Wait     CPU   CPU time  I/O time
Group          SID  USERNAME          STATE       Yields  Time (s)   Waits        (s)       (s)  PROGRAM       EVENT
-----------  -----  ----------------  ----------  ------  --------  ------  ---------  --------  ------------  --------------------------------------------
PROJ_A_GRP     508  PROJA_USR        RUNNING       1600       128    1600      255.5        .0  sqlplus@aser  resmgr:cpu quantum
PROJ_A_GRP     553  PROJA_USR        RUNNING       1599       122    1599      262.2        .0  sqlplus@aser  resmgr:cpu quantum
PROJ_A_GRP    1098  PROJA_USR        RUNNING          8         0       8      384.1        .0  sqlplus@aser  resmgr:cpu quantum
PROJ_B_GRP    1070  PROJB_USR        RUNNING          4         0       4      383.4        .0  sqlplus@aser  latch free
PROJ_B_GRP     523  PROJB_USR        WAITING FO    1844       146    1844      237.8        .0  sqlplus@aser  resmgr:cpu quantum
PROJ_B_GRP    1084  PROJB_USR        RUNNING          2         0       2      384.2        .0  sqlplus@aser  resmgr:cpu quantum
PROJ_B_GRP     496  PROJB_USR        RUNNING       1843       148    1843      236.2        .0  sqlplus@aser  resmgr:cpu quantum
PROJ_B_GRP    1075  PROJB_USR        RUNNING          0         0       0      384.4        .0  sqlplus@aser  latch free
PROJ_B_GRP     489  PROJB_USR        RUNNING       1836       146    1836      238.7        .0  sqlplus@aser  resmgr:cpu quantum

So here is my next puzzlement with RM:

  • Is it possible that CPU isn’t hitting 100% because RM is throttling the queries too much?

I suspect I’m misunderstanding something about how RM is supposed to work and/or how it is implemented to do what it does.

Test 07

Leaving to one side my inability to explain the above observations with RM, I then wantd to add more load so that the machine would be under serious CPU pressure, and see how RM dealt with it.

I would run:

  • 2 x OTHER_GROUP sessions
  • 5 x PROJ_A_GRP sessions
  • 1 x PROJ_B_GRP session
  • 10 x PROJ_C_GRP sessions
  • 1 x PROJ_D_GRP session

I would hope to see something like this:

  • OTHER_GROUP unthrottled – c.20% CPU, leaving c.80% for the four project consumer groups (thus 20% each)
    • PROJ_B_GRP unthrottled – only generating load on one CPU so c.12% host CPU (leaving c.8% available for use by other consumer groups)
    • PROJ_D_GRP unthrottled – only generating load on one CPU so c.12% host CPU (leaving c.8% available for use by other consumer groups)
    • This leaves 56% (100 – 20 – 12 – 12) of a theoretical 100% CPU available for two consumer groups which between them require more than that. Based on the above results I would expect the 1:2 session balance to play out in CPU allocation too, so roughly:
      • PROJ_C_GRP throttled to c.<40%
      • PROJ_A_GRP throttled to c.<20%

The test began at 2010-09-10 20:21:49, taking a total of three seconds for all 17 scripts to start.

As before, CPU did not hit 100%, but instead hovered around 87%. We’re quite clearly generating load sufficient to hit 100%, but RM is throttling it back. Whether it’s the effect of swapping queries on and off CPU that means there’s an efficiency loss, or whether RM deliberately holds it back to that level deliberately I don’t know.

The total Oracle and host CPU/time looks like this: (rm_cpu_01):

                     Total Available  Used Oracle  Used Host  Oracle Throttled
BEGIN_TIME               CPU Seconds      Seconds      CPU %          Time (s)
-------------------  ---------------  -----------  ---------  ----------------
2010-09-10 20:18:50              480          0.1        1.1               0.0
2010-09-10 20:19:50              480          0.1        3.1               0.0
2010-09-10 20:20:50              480         14.5        5.8               9.5
2010-09-10 20:21:51              480        421.4       88.1             675.4
2010-09-10 20:22:50              480        431.9       88.6             690.4
2010-09-10 20:23:50              480        433.6       88.7             685.5
2010-09-10 20:24:50              480        427.0       89.3             686.1
2010-09-10 20:25:50              480        424.2       89.5             683.1

The CPU allocation within RM breaks down as follows (rm_05):

                                                     Total Available            Used                 Oracle Throttled
TIME                 CONSUMER_GROUP_NAME                 CPU Seconds  Oracle Seconds  % of Host CPU          Time (s)
-------------------  ------------------------------  ---------------  --------------  -------------  ----------------
2010-10-09 20:22:50  PROJ_C_GRP                                  480           138.8           28.9             451.9
                     PROJ_A_GRP                                  480           115.0           24.0             179.7
                     PROJ_B_GRP                                  480            27.9            5.8              31.1
                     OTHER_GROUPS                                480           115.7           24.1               3.4
                     PROJ_D_GRP                                  480            34.5            7.2              24.4
                     SYS_GROUP                                   480             0.0            0.0               0.0
                     _ORACLE_BACKGROUND_GROUP_                   480             0.0            0.0               0.0
  • OTHER_GROUP gets c.25%, and isn’t throttled
  • PROJ_C_GRP gets c.25%, and is throttled
  • PROJ_A_GRP gets c.25%, and is throttled
  • PROJ_B_GRP gets c.6%, and is throttled
  • PROJ_D_GRP gets c.6%, and is throttled

(I’m taking a slight liberty with OTHER_GROUP and stating that it’s not throttled; but relative to the other groups it isn’t really)

rm_02 shows the amount of CPU wait time each session is subject to:

                                                                      Consumed
Consumer                                             CPU Wait    CPU  CPU time I/O time
Group         SID USERNAME         STATE      Yields Time (s)  Waits       (s)      (s) PROGRAM      EVENT
----------- ----- ---------------- ---------- ------ -------- ------ --------- -------- ------------ ------------------------------------------------------
PROJ_C_GRP    521 PROJC_USR       WAITING FO    954      581    954     103.0       .0 sqlplus@aser resmgr:cpu quantum
PROJ_C_GRP   1090 PROJC_USR       RUNNING      2269      451   2269     232.6       .0 sqlplus@aser resmgr:cpu quantum
PROJ_C_GRP   1070 PROJC_USR       WAITING FO   2254      452   2254     232.3       .0 sqlplus@aser resmgr:cpu quantum
PROJ_C_GRP    524 PROJC_USR       WAITING FO    950      583    952     100.9       .0 sqlplus@aser resmgr:cpu quantum
PROJ_C_GRP    486 PROJC_USR       WAITING FO    957      583    960     101.3       .0 sqlplus@aser resmgr:cpu quantum
PROJ_C_GRP    512 PROJC_USR       WAITING FO    958      582    961     102.4       .0 sqlplus@aser resmgr:cpu quantum
PROJ_C_GRP    496 PROJC_USR       WAITING FO    960      581    960     103.6       .0 sqlplus@aser resmgr:cpu quantum
PROJ_C_GRP   1098 PROJC_USR       WAITING FO   2263      451   2263     233.9       .0 sqlplus@aser resmgr:cpu quantum
PROJ_C_GRP    508 PROJC_USR       WAITING FO    954      581    954     104.0       .0 sqlplus@aser resmgr:cpu quantum
PROJ_C_GRP   1082 PROJC_USR       RUNNING      2272      451   2272     234.1       .0 sqlplus@aser resmgr:cpu quantum
PROJ_A_GRP    499 PROJA_USR       WAITING FO   2314      451   2315     233.2       .0 sqlplus@aser resmgr:cpu quantum
PROJ_A_GRP    509 PROJA_USR       RUNNING      2296      449   2296     235.3       .0 sqlplus@aser resmgr:cpu quantum
PROJ_A_GRP   1084 PROJA_USR       RUNNING      2138      263   2138     422.0       .0 sqlplus@aser latch free
PROJ_A_GRP    553 PROJA_USR       WAITING FO   2296      450   2296     235.5       .0 sqlplus@aser resmgr:cpu quantum
PROJ_A_GRP    491 PROJA_USR       RUNNING      2295      449   2295     236.1       .0 sqlplus@aser resmgr:cpu quantum
PROJ_B_GRP    498 PROJB_USR       RUNNING      2168      358   2170     326.7       .0 sqlplus@aser resmgr:cpu quantum
OTHER_GROUP   490 myuser0         RUNNING       853       36    853     648.6       .0 sqlplus@aser resmgr:cpu quantum
OTHER_GROUP  1075 myuser0         RUNNING        60        2     60     683.9       .0 sqlplus@aser resmgr:cpu quantum
PROJ_D_GRP   1079 PROJD_USR       WAITING FO   2131      269   2131     414.9       .0 sqlplus@aser resmgr:cpu quantum

So, I’m puzzled – I thought that RM was supposed to allocate a guarenteed amount of CPU to each consumer group. But here we’re seeing consumer groups with only one session getting apparently muscled out by those with multiple sessions. If OTHER_GROUPS is taking 25%, that leaves a hypothetical 75% between four consumer groups to split 25% each (so c.18% each). Instead two of the four get 25% total host CPU and two get about 6% host CPU – not 25% of the remainder of the pie left by OTHER_GROUPS.

Update: I re-ran Test 07, but observed the same behaviour:

                                                     Total Available            Used                 Oracle Throttled
TIME                 CONSUMER_GROUP_NAME                 CPU Seconds  Oracle Seconds  % of Host CPU          Time (s)
-------------------  ------------------------------  ---------------  --------------  -------------  ----------------
2010-13-09 07:53:42  PROJ_C_GRP                                  480           145.0           30.2             448.5
                     PROJ_A_GRP                                  480           132.8           27.7             163.9
                     PROJ_B_GRP                                  480            21.3            4.4              38.3
                     OTHER_GROUPS                                480           115.8           24.1               3.2
                     PROJ_D_GRP                                  480            21.9            4.6              37.5
                     SYS_GROUP                                   480             0.0            0.0               0.0
                     _ORACLE_BACKGROUND_GROUP_                   480             0.0            0.0               0.0

Why aren’t and PROJ_B_GRP PROJ_D_GRP getting an equal share of CPU as PROJ_A_GRP and PROJ_C_GRP?

What’s next?

I’m going to re-run some of the above tests to check that the same behaviour is seen. I’m also planning to test with non-Oracle processes using lots of CPU to see how RM deals with that.
We’re considering how RM fits into Performance Testing our applications, as it introduces quite a possible varience in the response times the users could see in Production.
Finally, it will be interesting to observe RM in action against real DW workloads where there may be lots of I/O waits and not pure CPU demand.

Summmary

It’s been very interesting running these tests and looking closely at what RM appears to be doing. Some of my understanding & assumptions have been challenged, and I would love to hear from people with more experience and knowlegde of RM and Oracle to explain what I’m observing and where I’ve gone wrong.
All of the query results quoted here are representative of the steady-state seen during each test.
I’m sure I’ve just misunderstood part of the principle of RM, but I would like to know in what way 🙂 and also if there is a way to implement what I thought we had – a way of ensuring that of four consumer groups they all get a fair and equal bite of the pie.
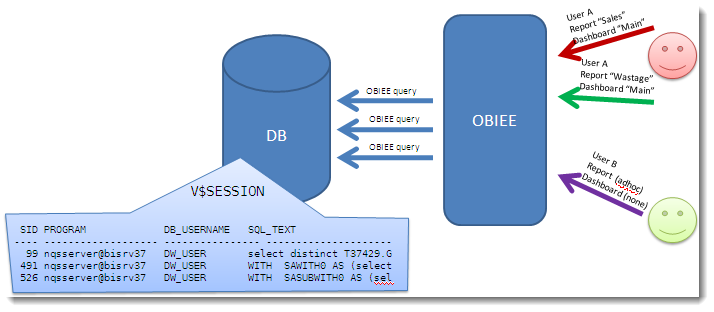
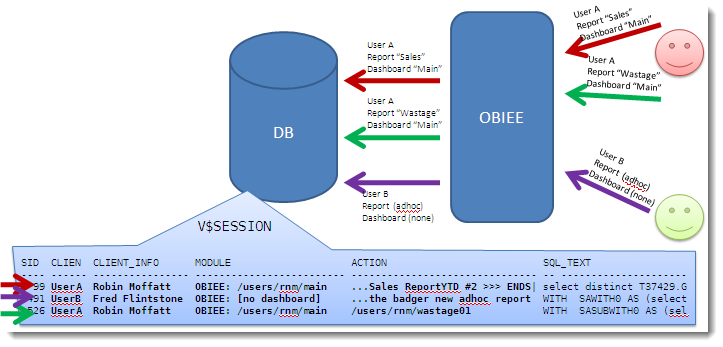
June 14, 2010

Measuring real user response times for OBIEE

Filed under: obiee, performance, sawserver — rmoff @ 12:54

@alexgorbachev tweeted me recently after picking up my presentation on Performance Testing and OBIEE.

His question got me thinking, and as ever the answer “It Depends” is appropriate here 🙂

Why is the measurement being done?

Without knowing the context of the work Alex is doing, how to measure depends on whether the measurement needs to be of: –

  1. The actual response times that the users are getting, or
  2. The response times that the system is currently capable of delivering

This may sound like splitting hairs or beard-scratching irrelevance, but it’s not. If the aim of the exercise is to be able to make a statement along the lines of:

On Monday morning between 09:00 and 10:00 we saw system response times of x seconds

then we can consider simulating a user and recording response times this way. After all, what difference does it make whether it’s Jim, Jemima or Jeremy using the system, or a simulated web client? They’re all sending an HTTP request to the same web server, hitting the same presentation services, BI server, and database.
If on the other hand we want to say something like:

On Monday morning between 09:00 and 10:00 response times experienced by the end user were x seconds

then we need to audit and trace user activity through some means. We can’t use a simulated user session, because it would only ever be that – simulated. If a user says that the system performance is awful then you need to be able to quantify and diagnose that, and the best way is through their eyes. A simulated user is only ever going to be a best-guess of user activity, or even if it’s a replay of past behaviour it may not be the same as they’re doing currently.

These considerations also feed into the point at which we take the measurements. There is no out of the box tracking of response times at the end-user, but there is out of the box tracking of response times at the BI Server. If you are happy to settle for the latter then you save yourself a lot of work. If your requirement is to give an extremely accurate figure for the response time at the end-user then Usage Tracking data from the BI Server is irrelevant (because it doesn’t account for time spent in Presentation Services). However, if you know anecdotally that your reports aren’t that complex and generally time in Presentation Services is minimal then you should consider Usage Tracking, unless the precision required for response time is so great. Consider which is better – to spend an hour configuring Usage Tracking and get response times accurate to within a few seconds (assuming that Presentation Services time is either minimal or consistent so can be factored in), or spend x days or weeks trying to hack together a way or measuring times at the end user — is the extra accuracy definitely necessary?
See slides 11-13 of my presentation for more discussion around this and defining the scope of a test and measurement taking.

So, these thoughts aside, what are the options for examining response times at the end-user point of OBIEE?

Actual response times as experienced by users

As discussed above, Usage Tracking data will get you the response times at the BI server, but doesn’t include anything upstream of that (Presentation Services, App/Web server, network, client rendering).
The options that I can think of for recording timings at the end user are:

  1. Presentation Services Session Monitor – This is a point-in-time record in Presentation Services of each request that is served. It logs the Logical SQL, request type and source, user, records returned, and response time. For a single dashboard there may be many entries. It’s entirely transient so far as I know, so is only useful for observing a session as it happens. It would be nice if there were a web services interface to this but it doesn’t look like there is. You can access it directly at http://%5Bserver%5D:%5Bport%5D/analytics/saw.dll?Sessions
  2. Log mining – sawserver – The presentation services log file, sawserver.log, can be configured to record detail down to a very low level, certainly enough to be able to track user requests and responses. However unless you’re looking at diagnosing a problem for a specific user then this method is probably unrealistic because such levels of logging on a production server would be unwise.
  3. Client side logging – some kind of hack to monitor and record the user’s experience. Something like FireBug or Fiddler2 in logging mode? Not very viable unless it’s low number of users and you have access to their web browser & machine.

Bear in mind that options 1 and 2 only give the response time as far as Presentation Services; they do not include network and rendering at the client. In some cases these times can be considerable (particularly if you have badly designed reports).

Response times of the system

If you’re just trying to measure response times of requests sent to Presentation Services there are several possibilities. As above it depends on the aim of your testing as to which approach you choose:

  1. Simulate user client activity – Use a web client testing tool (eg. Load runner, OATS, Selenium) to record and replay user actions in Answers/Dashboards as if through a web browser, and capture the timings. NB just because Load Runner is best known for Load testing, there’s no reason it can’t be used for replaying individual users to measure standard response times rather than under load. I think (although haven’t tried) HP’s BAC can also replay LoadRunner VUser scripts and capture & monitor timings over time, alerting for deviances.
  2. Go URL – Documented in Chapter 11 of the Presentation Services Admin Guide (and Nico has a nice summary and set of examples here), this is a way of issuing direct requests to Presentation Services by building up the request in the URL. Using this method you could then wrap a simple wget / curl script around it and build up a set of timings that way.
    curl -o c:\scratch\tmp.html "http://[server]:[port]/analytics/saw.dll?Dashboard&PortalPath=%2Fshared%2FFinancials%2F_portal%2FPayables&Page=Overview&NQUser=User&NQPassword=Password"

    Bear in mind that Answers/Dashboards are asynchronous so the first server response may not equate to a fully-loaded dashboard (you may get “Searching … ” first, and then the chart/table is delivered & rendered). See some of the discussion on my earlier postings around Load Runner, particularly this one.

  3. Web services – documented here, this would be similar to Go URL, in that it’s a way of requesting content from Presentation Services in a way that can be scripted and thus timed – but again is not necessarily reproducing the full user experience so make sure you’re aware of what you are and are not actually testing.
  4. Can anyone suggest other options?

Older Posts »

Create a free website or blog at WordPress.com.